Shock response: Designing for the full spectrum
What is a Shock Response?
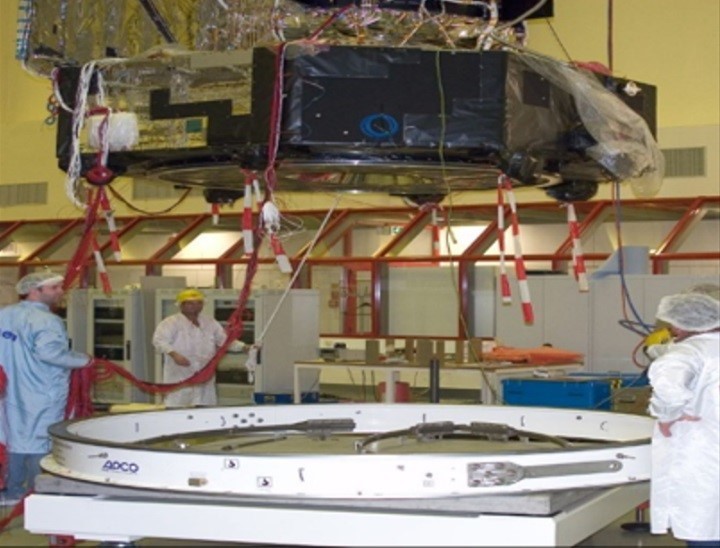
The shock Response is a very short duration transient phenomenon that can result in parts malfunctioning, developing stress fractures, and in some cases, shattering. Examples of mechanical shocks include drop impact, earthquake, and pyrotechnic shock. A structural engineer must design products that can withstand shocks and prevent excessive vibrations from generating unsustainable stress levels. The process they use to analyze the shock, ‘Transient Response Analysis,’ computes the forced dynamic response to determine the behavior of a structure when subjected to a time-varying excitation.
The example shock response engineer
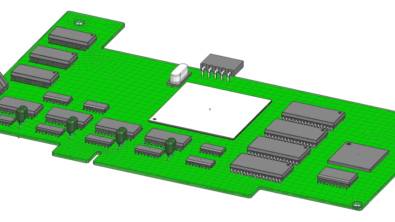
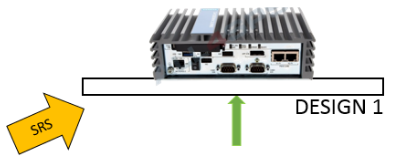
Let’s take an example where a structural engineer receives an assignment to design a structure onto which you can mount components. For example, the design of an electronic chassis structure on which you can mount electronic components. The structural Engineer must now work with both the base structure (in this case the chassis) and the component to withstand the shocks. Engineers working on this kind of task can often be handed design changes to both the base and the components mounted on it.
His first assumption
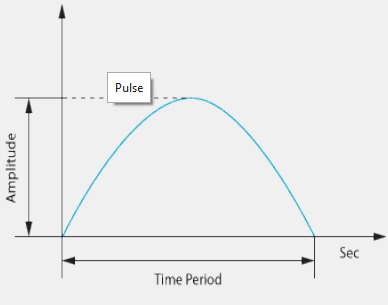
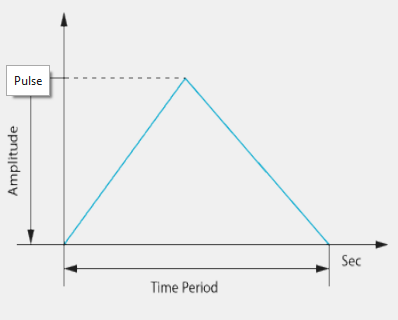
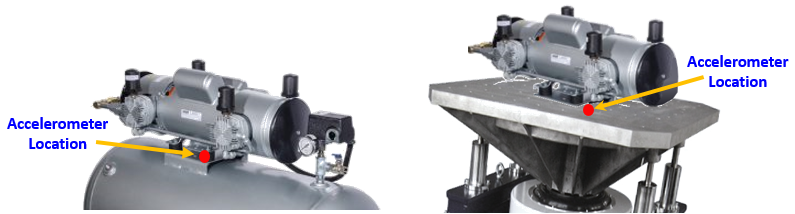
It is reasonable to assume that shock transmits through the base structure, therefore, the engineer will first focus on the design of the base structure. To replicate the shock event, the engineer needs the acceleration profile that defines the shock. To acquire this information, the engineer obtains the acceleration time history of the shock event through measurements or, if this is not possible, he uses a classical pulse base input such as a sine pulse to simulate the shock loading. He now has a pulse signal but nothing to apply it to, so his next step is to build a finite element model of the base structure. However, because the components to be mounted are either unknown or still in development, he has to use idealized versions of the components in his model.
An initial approach
Once the engineer has built the finite element model, he can apply the acceleration time history and compute the various stress and acceleration responses, including those at component attachment points. From these responses, he can determine if the base structure can withstand the shock by checking that the von Mises stresses are within limits. It comes as no surprise to him that his first design was not successful. After all, he must consider the various imposed design requirements.
An engineer with access to advanced software such as Simcenter 3D could approach a problem like a researcher. In such a case, they would create a Design of Experiments (DoE) investigation with HEEDS, that would run their simulation hundreds or even thousands of times, tuning the parameters until they found an optimal design. However, such experiments are costly with regards to simulation time and computer resources. In this case, where we need large complex finite element models, the resource costs are exceedingly high and take hours, days, or even longer to find the optimal design.
Model updated by the design team
Once the Engineer has found the optimal design, it would not be unusual for him to receive new design revisions. Since the main intention here is to design the base that allows vibrations without causing damage to the components mounted on it. The Engineer will redo the transient response analysis of the finite element model and obtain the responses at the component attachment locations. It is natural for the Engineer to compare the transient response before and after the design change. However, without the actual components modeled, the Engineer cannot be sure just by looking at the new response curves generated if it is better or worse than the baseline results (obtained before the change).
For every design change of the base structure and components, the Engineer must rerun his very computer-intensive analysis process. The Engineer will also have to consider shocks, such as earthquakes or pyrotechnic shocks, that he does not know about prior. As a result, the initial baseline runs must be established for various magnitudes and time pulses to obtain an envelope of responses.
Finding a cheaper solution
Since transient analysis is expensive, the Engineer doesn’t have much choice but to explore frequency or harmonic response analysis. Where he will need to convert the time signal to the frequency domain using Fast Fourier transform. The cost of frequency domain analysis is significantly lower than a transient analysis. However, frequency-domain analysis also has its limitations. Such as, what happens if there is an amplitude variation at a given frequency other than the one designed for? Would the product be at risk of failing? Another option the Engineer can explore is to convert the time signal to Power Spectral Densities (PSD) of excitation. This is equally challenging as the Engineer does not know the time duration or sample to perform averaging on. That is, the challenge here is the unknown and uncertainty of the excitation.
What do we use the shock response spectrum for?
The challenge with the traditional approaches is that they require knowledge of the general dynamic characteristics of the components, that is, the resonant frequencies of the components that are likely to be mounted on the base structure. Without this information, it is hard to predict the component’s response to the base structure’s shock event.
Shock Response Spectra to the Rescue
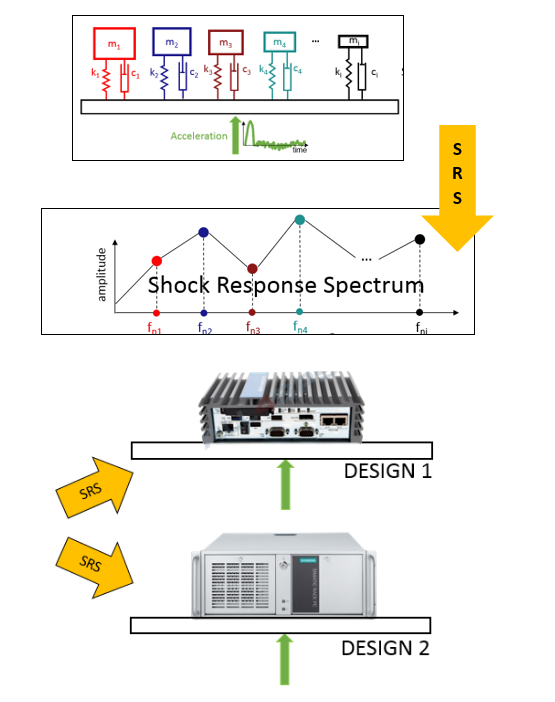
With the shock response spectrum, the components mounted on the base are replaced by single-degree of freedom oscillators. We use a sufficient number of oscillators to cover the entire frequency range of interest. That is, equivalent to mounting thousands of oscillators to mimic the possible component resonant frequencies. When the base is subject to shock, each of the oscillators will vibrate with a particular amplitude as a function of time. From an Engineer’s perspective, the goal is to design a component against failure. It is easy to focus on peak values for each of the oscillators (absolute maximum value of the response). We can find the shock response spectrum if we plot the oscillator resonant frequencies on the x-axis and the amplitudes on the y-axis.
The transient signal, in essence, is converted to the frequency domain. To evaluate the design, we can mount a new or a set of new components to the same base location and use the same Shock Response Spectrum (SRS) profile. The SRS does not change for a given base structure or shock transient. We can easily compare two shock design curves because they simply reflect the maximum possible amplitude of a resonator mounted on the base structure. The Engineer, in this case, can simply use the envelope of the two curves to design vibration-safe components.
Equipped with this information, the Engineer can now decouple the component design from the base structure design independent of the components. He can simply use an envelope of SRS curves if he has only historical data available, for example, earthquake data taken from various quakes from several regions.
SRS in Simcenter 3D
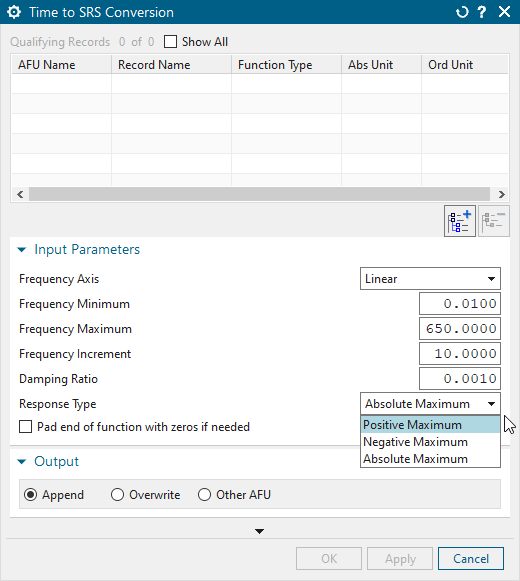
The structural Engineer need not fret about creating the SRS data. Simcenter 3D makes the task of SRS data generation quite easy. The user interface (UI) for this can be accessed from the Response Dynamics toolbar.

The Engineer can input shock function transient data as either raw data or in spreadsheet form. He can then use the stored function as an input to the “Time to SRS conversion” toolkit. Additionally, The designer can create a spectrum of positive maximum, negative maximum, or absolute maximum values as needed.
Response Spectra Analysis
Generation of shock response spectra from transient shock data is the first step in determining if components can withstand the vibrations and stresses.
The Engineer can now use the finite element model of components mounted on the base. The first step is to compute the modes of the components. The contribution of each mode is then the product of displacement value (converted from acceleration SRS to displacement SRS) corresponding to the natural frequency and the modal participation factor (see for example link). The scaled modes then must be combined to obtain the total response. Using the total response, the structural Engineer can then see if the von Mises stresses are high enough for yield or fracture. In applications such as the nuclear piping design, it is also important that the total acceleration where brackets are mounted does not exceed allowable limits.
Following the guidelines
We usually perform modal combinations according to specific guidelines laid out by regulatory committees such as Nuclear Regulatory Committee (NRC) as explained by “Regulatory Guide.” With Absolute (ABS) modal combination method, as the name indicates, we sum the absolute value of the responses from individual modes to obtain the total response. The more modes considered, the more conservative the design. The ABS modal combination method is the most conservative estimate for any design because summing all the modes significantly overpredicts the response. Alternatively, we could consider this overprediction as a large safety factor in the design.
The SRSS (Square root of the sum of the squares) combination method, on the other hand, simply sums up the square of the responses of the individual modes, the square root of which gives the total response. Some of the other combination methods required by Nuclear Regulatory Committee, American Society of Civil Engineers (ASCE) and NRL (Naval research Laboratory) for specific Industry needs include the following: CQC, NRL, NRC Double Sum, Ten Percent, Grouping and Rosenblueth’s Double Sum.
The shock response and its spectrum’s regions
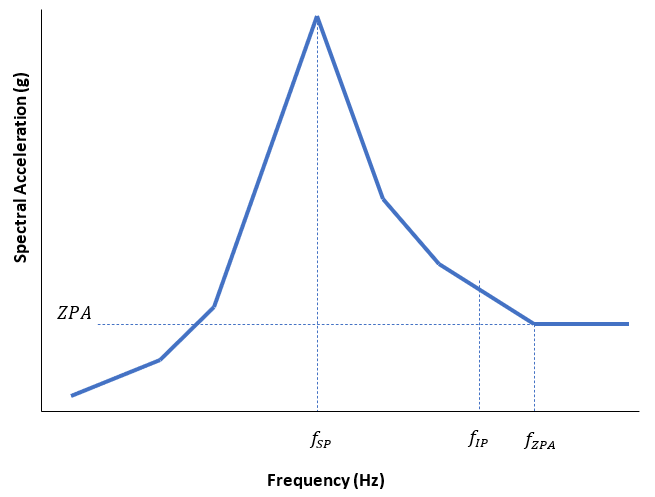
Selection of the modal combination method according to regulatory guidelines requires a little understanding of the regions in shock spectrum. Typically we divide the spectrum into 3 distinct regions, as you can see in the figure below:
- Frequencies below fSP. At these frequencies, responses are typically out of phase with the input transient shock. In this region, the ABS, SRSS, NRC, NRC double sum, Ten Percent, Grouping, Rosenblueth’s Double Sum, and summation methods are applicable.
- Frequencies above fZPA. This region is characterized by responses being in phase with excitations. In this region, the response is simply the product of mass, i.e., mass not participating in the modal response (missing mass) and the zero-period acceleration (ZPA)
- Frequencies below fSP and above fZPA This is a transition region between out-of-phase and in-phase responses. Special methods such as the Gupta and Lindley-Yow combination methods are used to compute the modal responses
Shock spectrum regions summarized
To summarize, to design components that do not exceed the vibration levels and stress levels, the Engineer only needs the SRS data and the finite element model of the components. This data is often available to the Engineer. However, when it is not provided, it can be easily generated. Given the SRS data and the application-specific needs, the Engineer can use one of the combination methods to compute the response.
The computational time for response spectra analysis is an order of magnitude smaller than a full transient analysis. When a component is modified or re-designed, the Engineer simply replaces the finite element model with the new version, computes a new set of modes and their modal participation factors. From these results, he can then calculate the new responses. Now he can complete the analysis of multiple revisions with a fraction of the computation cost of a full transient analysis.
Setting up Response Spectra Analysis
Simcenter 3D offers the tools the Engineer needs to perform design analysis. The Engineer can start by building the topology or the geometry in Simcenter 3D and then mesh the components. Using synchronous technology design we can make changes easily (For example: adding ribs, de-featuring of holes, and other attributes). Design changes trigger automatic updates of the mesh, loads, and boundary conditions. If we mount more than one component on the base, the Engineer can use the assembly modeling in Simcenter 3D. With this tool, he can assemble the various components. If the model came from a supplier or contractor, Simcenter 3D allows the Engineer to replace the CAD component or the finite element model.
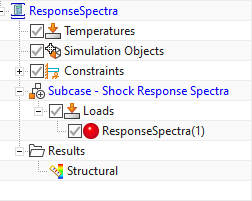
The Engineer can easily set up a “Response Spectra” solution, as shown here. The Engineer can define the number of modes required to be computed for the component model or define a frequency range for computing the modes.
The shock response spectra are then specified as an enforced vibration load, as shown below. The structural Engineer can define the location and direction of shock. Excitations can be defined at one or more locations and in one or more directions.
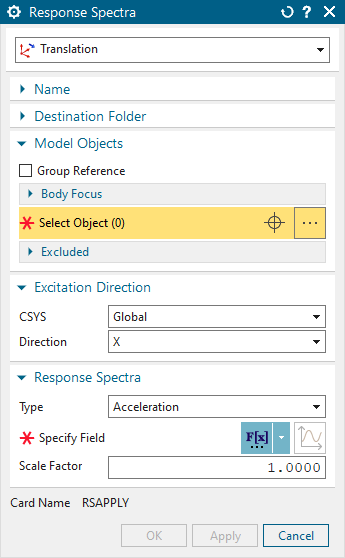
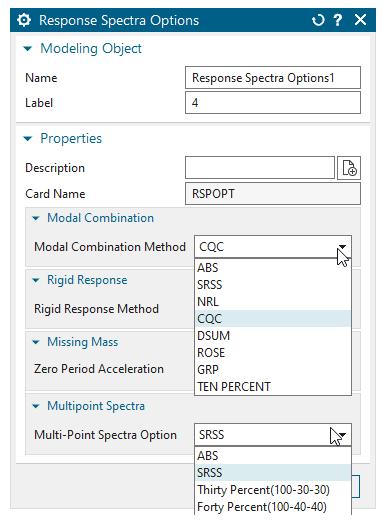
Simcenter 3D makes it easy for an engineer to select the various modal combination options. If the specification of the SRS is at more than one location and/or direction, the Engineer can select from the different multi-spectra combination methods to compute the response.
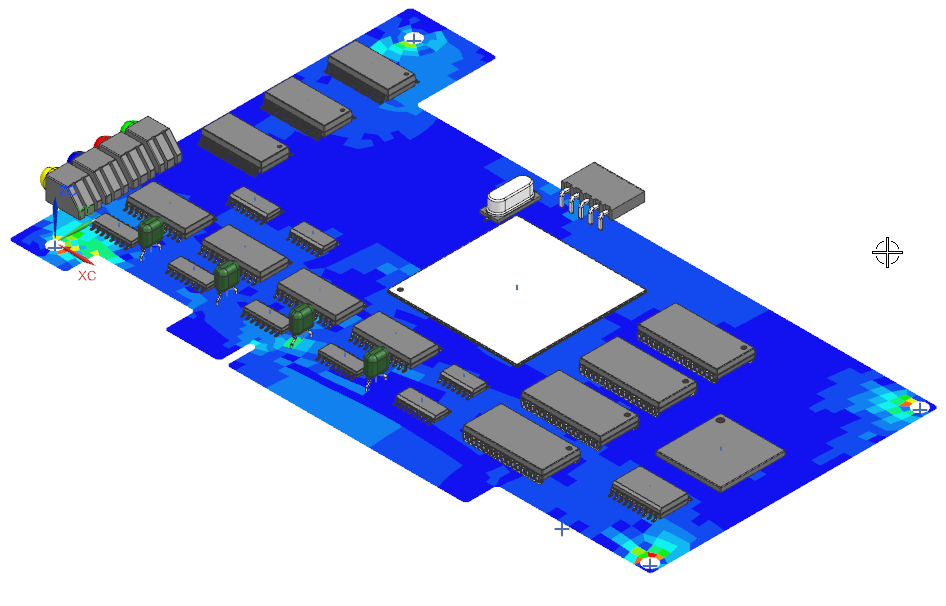
Visualize the results
The Engineer can visualize the results of response spectra analysis in the post-processing task. This visualization helps him locate the hot spots in the design which need attention. The figure below shows the von Mises stresses for an electronic component subject to shock loads. Output such as this helps an engineer quickly zoom in into locations where they require design changes to compensate against vibration shock.
Summary of studying the shock response
The Engineer has the response spectra analysis method at his disposal to design his components to withstand vibration shock. Simcenter 3D’s ease of use makes design changes in this process much easier. In lieu of the full transient analysis with the design uncertainties associated with it, the Engineer can now use the shock spectra analysis to iterate significantly faster on design changes. This enables rapid prototyping at a reduced computation cost.
Related Content
On-demand webinar
Electronics shock and vibration evaluation – testing and simulation methods
Blogs
What’s new in Simcenter 3D 2206


