Prologue: The 2016 Wilson Research Group Functional Verification Study
This is the first in a series of blogs that presents the findings from our new 2016 Wilson Research Group Functional Verification Study. Similar to my previous 2014 Wilson Research Group functional verification study blogs, I plan to begin this set of blogs with an exclusive focus on FPGA trends. Why? For the following reasons:
- Some of the more interesting trends in our 2016 study are related to FPGA designs. The 2016 ASIC/IC functional verification trends are overall fairly flat, which is another indication of a mature market.
- Unlike the traditional ASIC/IC market, there has historically been very few studies published on FPGA functional verification trends. We started studying the FPGA market segment back in the 2010 study, and we now have collected sufficient data to confidently present industry trends related to this market segment.
- Today’s FPGA designs have grown in complexity—and many now resemble complete systems. The task of verifying SoC-class designs is daunting, which has forced many FPGA projects to mature their verification process due to rising complexity. The FPGA-focused data I present in this set of blogs will support this claim.
My plan is to release the ASIC/IC functional verification trends through a set of blogs after I finish presenting the FPGA trends.
Introduction
In 2002 and 2004, Collett International Research, Inc. conducted its well-known ASIC/IC functional verification studies, which provided invaluable insight into the state of the electronic industry and its trends in design and verification at that point in time. However, after the 2004 study, no additional Collett studies were conducted, which left a void in identifying industry trends. To address this dearth of knowledge, five functional verification focused studies were commissioned by Mentor Graphics in 2007, 2010, 2012, 2014, and 2016. These were world-wide, double-blind, functional verification studies, covering all electronic industry market segments. To our knowledge, the 2014 and 2016 studies are two of the largest functional verification study ever conducted. This set of blogs presents the findings from our 2016 study and provides invaluable insight into the state of the electronic industry today in terms of both design and verification trends.
Study Background
Our study was modeled after the original 2002 and 2004 Collett International Research, Inc. studies. In other words, we endeavored to preserve the original wording of the Collett questions whenever possible to facilitate trend analysis. To ensure anonymity, we commissioned Wilson Research Group to execute our study. The purpose of preserving anonymity was to prevent biasing the participants’ responses. Furthermore, to ensure that our study would be executed as a double-blind study, the compilation and analysis of the results did not take into account the identity of the participants.
For the purpose of our study we used a multiple sampling frame approach that was constructed from eight independent lists that we acquired. This enabled us to cover all regions of the world—as well as cover all relevant electronic industry market segments. It is important to note that we decided not to include our own account team’s customer list in the sampling frame. This was done in a deliberate attempt to prevent biasing the final results. My next blog in this series will discuss other potential bias concerns when conducting a large industry study and describe what we did to address these concerns.
After data cleaning the results to remove inconsistent or random responses (e.g., someone who only answered “a” on all questions), the final sample size consisted of 1703 eligible participants (i.e., n=1703). This was approximately 90% this size of our 2014 study (i.e., 2014 n=1886). However, to put this figure in perspective, the famous 2004 Ron Collett International study sample size consisted of 201 eligible participants.
Unlike the 2002 and 2004 Collett IC/ASIC functional verification studies, which focused only on the ASIC/IC market segment, our studies were expanded in 2010 to include the FPGA market segment. We have partitioned the analysis of these two different market segments separately, to provide a clear focus on each. One other difference between our studies and the Collett studies is that our study covered all regions of the world, while the original Collett studies were conducted only in North America (US and Canada). We have the ability to compile the results both globally and regionally, but for the purpose of this set of blogs I am presenting only the globally compiled results.
Confidence Interval
All surveys are subject to sampling errors. To quantify this error in probabilistic terms, we calculate a confidence interval. For example, we determined the “overall” margin of error for our study to be ±2.36% at a 95% confidence interval. In other words, this confidence interval tells us that if we were to take repeated samples of size n=1703 from a population, 95% of the samples would fall inside our margin of error ±2.36%, and only 5% of the samples would fall outside. Obviously, response rate per individual question will impact the margin of error. However, all data presented in this blog has a margin of error of less than ±5%, unless otherwise noted.
Study Participants
This section provides background on the makeup of the study.
Figure 1 shows the percentage of overall study FPGA and ASIC/IC participants by market segment. It is important to note that this figures does not represent silicon volume by market segment.
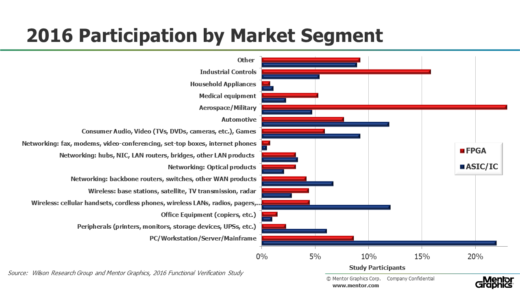
Figure 1: FPGA and ASIC/IC study participants by market segment
Figure 2 shows the percentage of overall study eligible FPGA and ASIC/IC participants by their job description. An example of eligible participant would be a self-identified design or verification engineer, or engineering manager, who is actively working within the electronics industry. Overall, design and verification engineers accounted for 60 percent of the study participants.
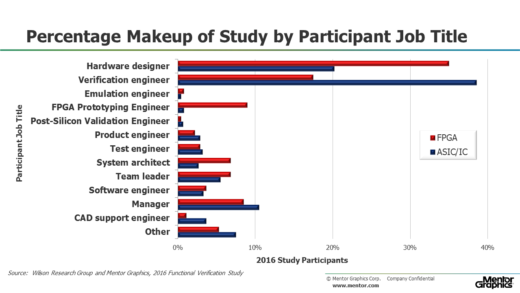
Figure 2: FPGA and ASIC/IC study participants job title description
Before I start presenting the findings from our 2016 functional verification study, I plan to discuss in my next blog general bias concerns associated with all survey-based studies—and what we did to minimize these concerns.
Quick links to the 2016 Wilson Research Group Study results
- Prologue: The 2016 Wilson Research Group Functional Verification Study
- Understanding and Minimizing Study Bias (2016 Study)
- Part 1 – FPGA Design Trends
- Part 2 – FPGA Verification Effort Trends
- Part 3 – FPGA Verification Effort Trends (Continued)
- Part 4 – FPGA Verification Effectiveness Trends
- Part 5 – FPGA Verification Technology Adoption Trends
- Part 6 – FPGA Verification Language and Library Adoption Trends
- Part 7 – ASIC/IC Design Trends
- Part 8 – ASIC/IC Resource Trends
- Part 9 – ASIC/IC Verification Technology Adoption Trends
- Part 10 – ASIC/IC Language and Library Adoption Trends
- Part 11 – ASIC/IC Power Management Trends
- Part 12 – ASIC/IC Verification Results Trends
- Conclusion: The 2016 Wilson Research Group Functional Verification Study