The magic in electric vehicle road noise engineering
Road noise for electric vehicle development, when I informed my son that I work as an engineer in the automotive field, he didn’t show much interest. However, when I explained that engineers can perform some magical tasks, he became instantly intrigued. He wanted to witness the magic firsthand, so he would come to my table to discover what my work actually involves. Although it’s difficult to judge a 5-year-old’s level of agreement, I believe he was captivated by what he observed. Let’s explore together what I showed him.
Electric Vehicle Development – How to start?
When it comes to vehicle NVH development, the question arises as to where to begin and how to approach it. Furthermore, we aim to start working on the entire vehicle at the earliest opportunity.
Luckily, in recent years, there has been rapid growth in the use of innovative TPA methodologies, particularly in the automotive industry, to virtually combine components into assemblies and predict their noise and vibration performance. These methodologies have proven to be powerful tools for engineers to evaluate component modification scenarios and assess the overall NVH (Noise, Vibration, and Harshness) performance of vehicles efficiently. Let me show you an example of what we have done on road noise and catch together a glimpse of magic.
C-TPA and Virtual Prototype Assembly for Road Noise
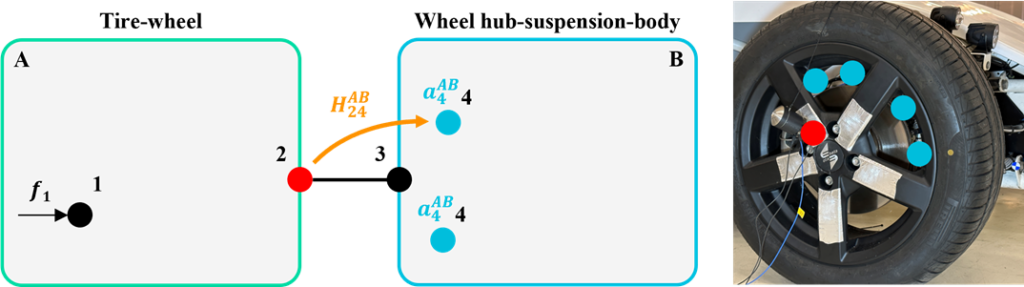
Component-based Transfer Path Analysis (TPA) allows for the prediction of NVH analysis in an assembly by utilizing independent characterizations of individual components. These components are virtually coupled using Frequency Based Substructuring (FBS). The source components are characterized by invariant loads and impedance at their output connections, while the receiver components are characterized by impedance and transfer sensitivities between their input and output connections.
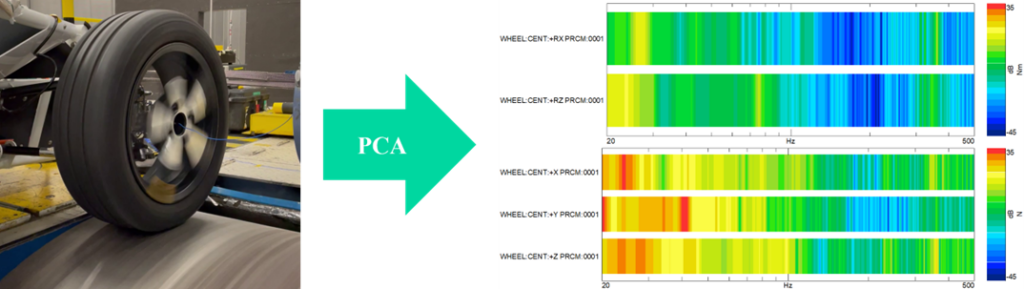
To determine the tire wheel blocked forces, the in-situ TPA method is employed. In many cases, Principal Component Analysis (PCA) is then applied to each indicator cross-power matrix. This decomposition technique allows for the identification of different excitation phenomena and enables the analysis of operational indicator response spectra per principal component.
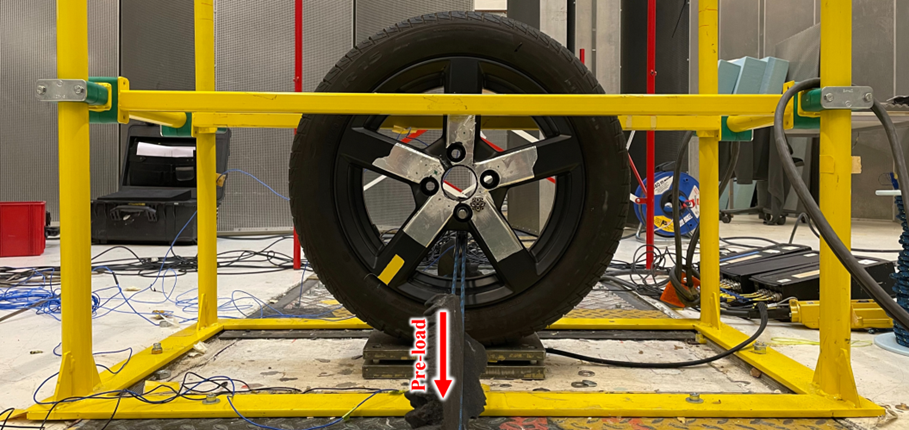
In a second set-up tire-wheel impedance FRFs are measured. Again, Virtual Point Transformation (VPT) is applied.
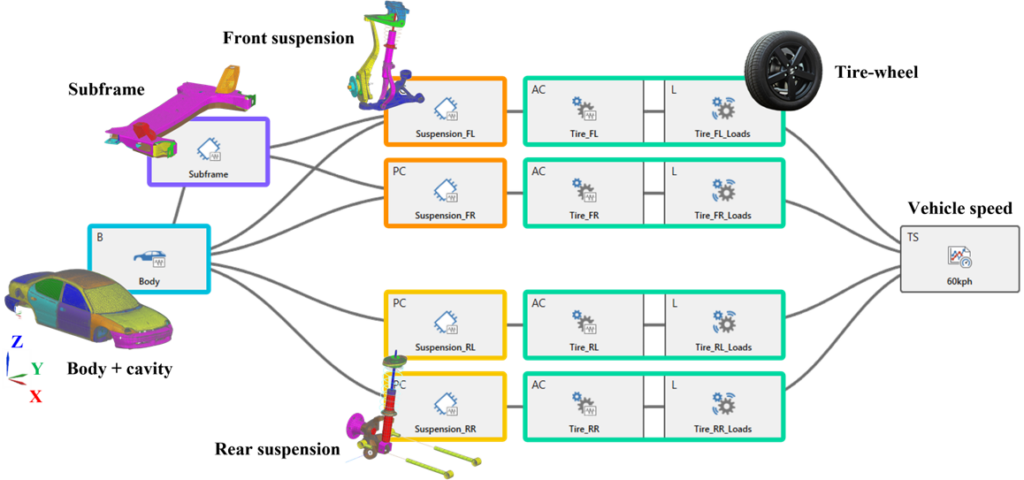
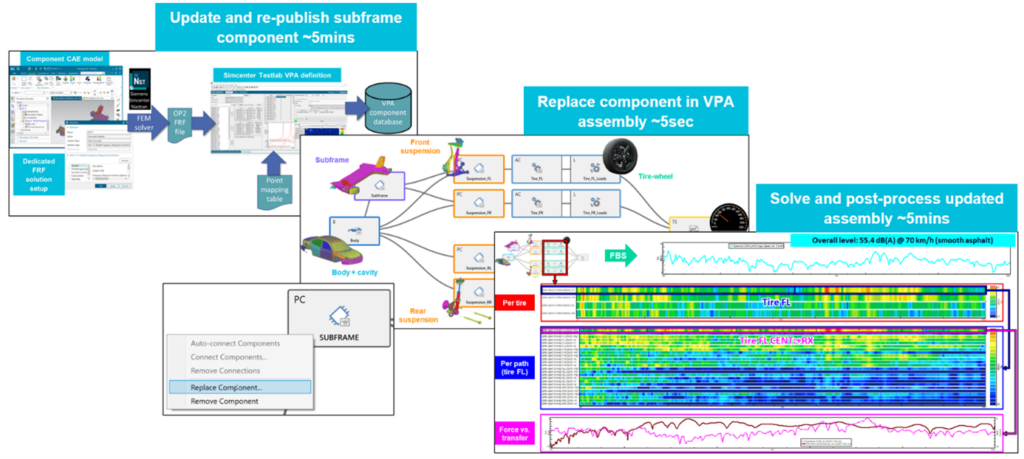
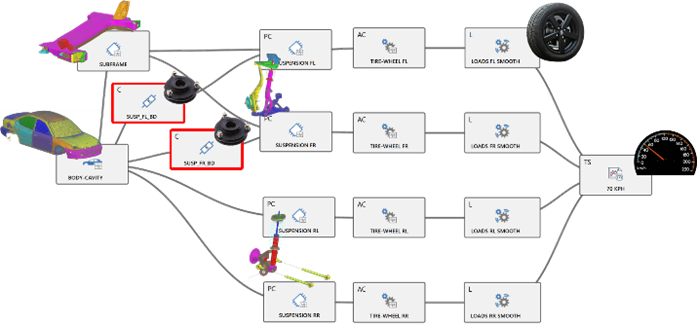
We could now continue measuring our body FRFs and point impedance, but in this case, we want to couple to simulation data. The image below shows such a Virtual Prototype Assembly (VPA) setup with test and CAE data.
How can we create a VPA component library from Simulation results?
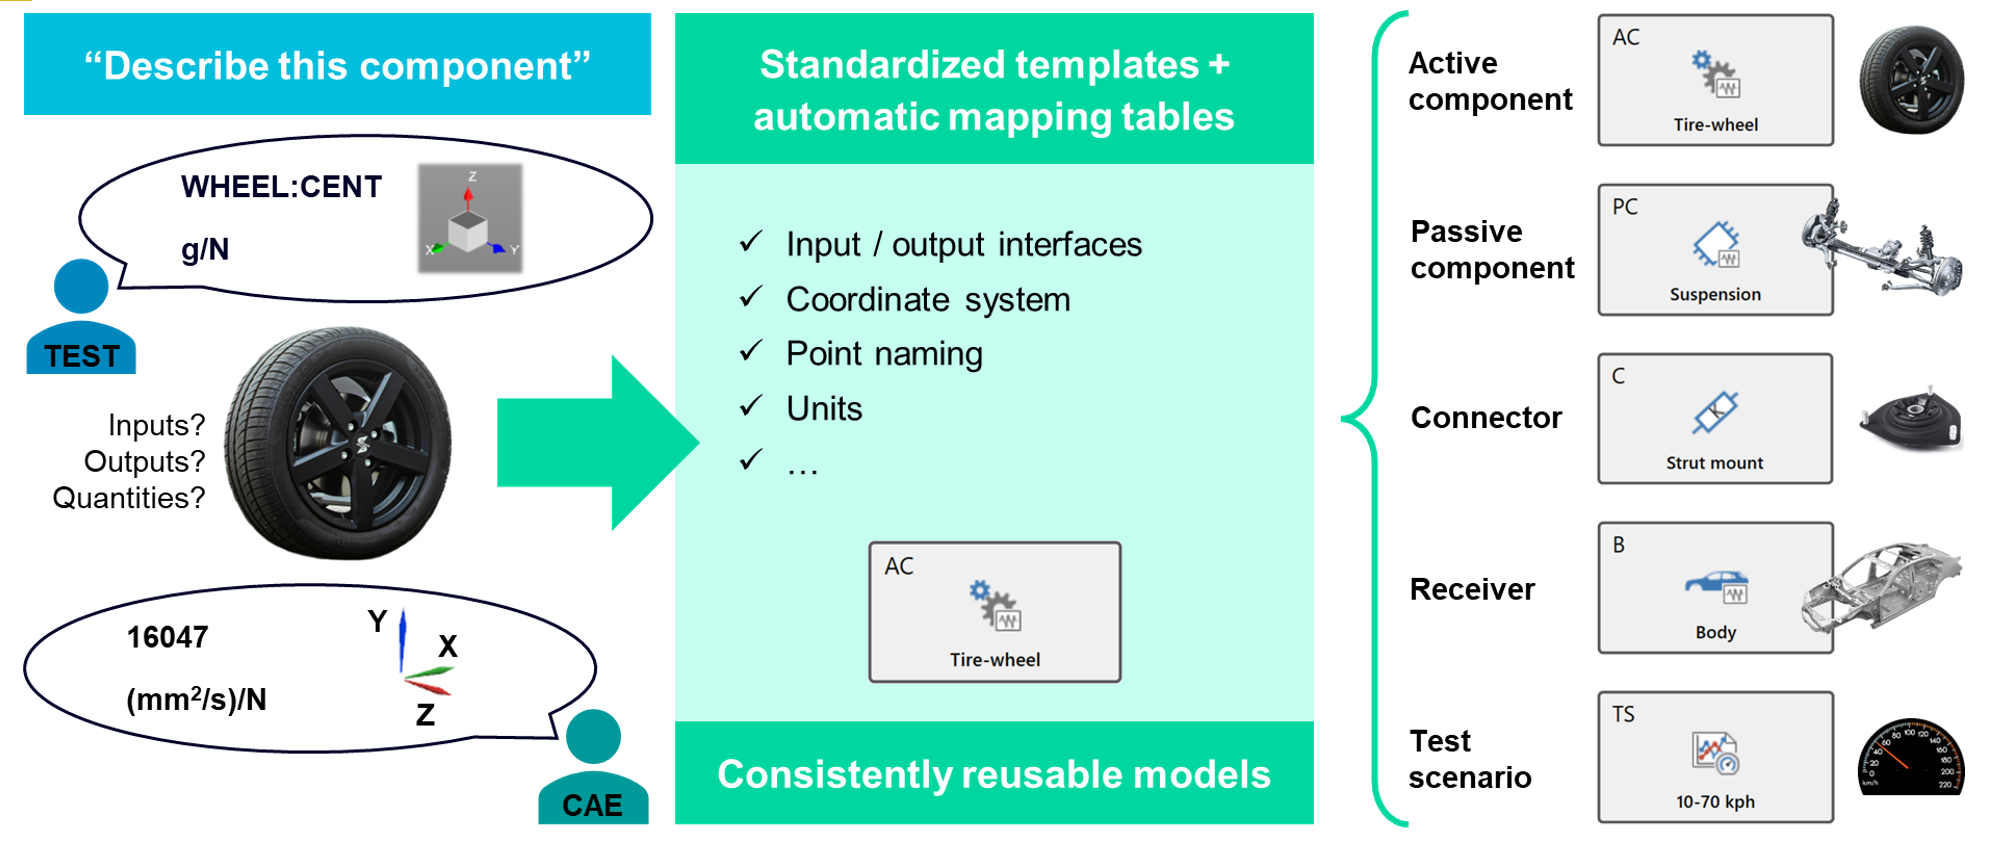
You know for sure already that Virtual Prototype Assembly (VPA) has a dedicated set-up including standardized templates and mapping tables and a set of components that allow the creation of full Simcenter Testlab model either from test or simulation.
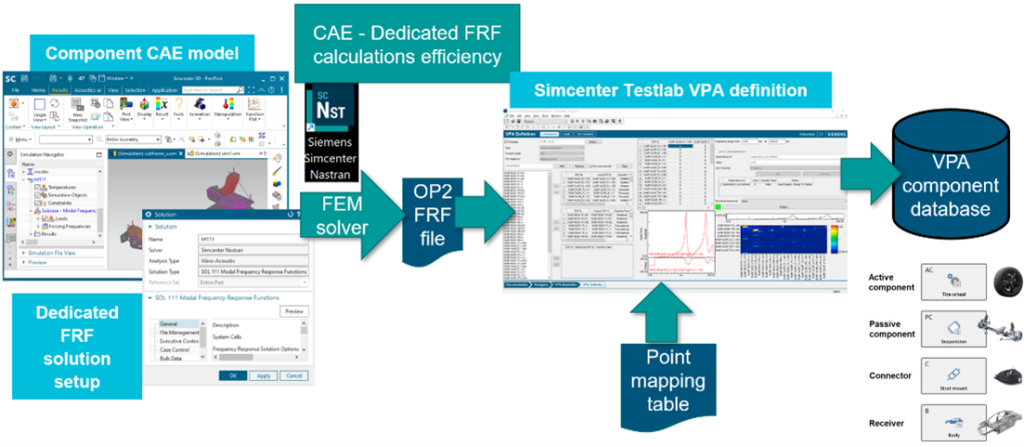
Below, the process of components using OP2 files, here coming from Simcenter 3D. Publishing time from OP2 file to VPA database entry <1min thanks to automated point mapping and use of templates.
Here comes the little magic of an application case coupling Test/CAE data
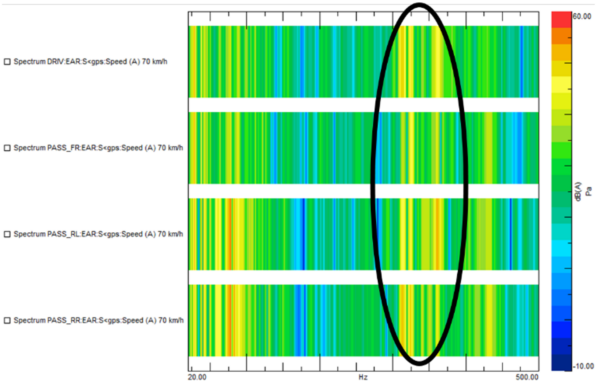
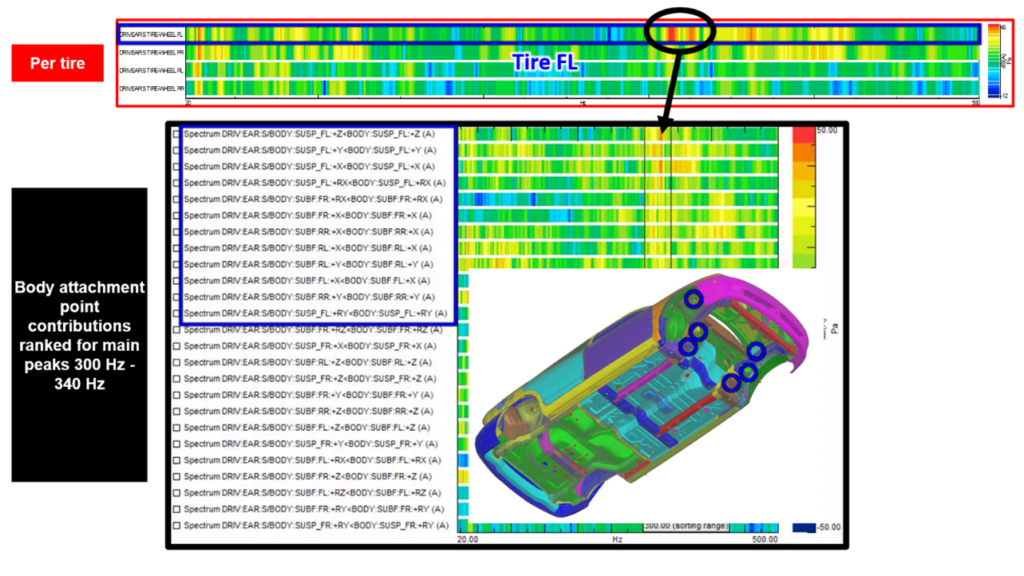
In this part, the focus is on evaluating and improving the road noise performance of the vehicle. The total noise level at four target locations is analyzed, revealing that the highest response spectrum levels occur between 300-400 Hz, with two peaks in the 300-340 Hz range.
The driver’s ear pressure is decomposed into partial contributions per tire-wheel, with the front-left tire-wheel identified as the dominant component. Further decomposition into partial contributions per path for the front-left tire-wheel shows that the direct RX DOF is the dominant path. Analyzing the assembly contact forces and transfer FRFs in this path reveals that high force levels overlap with relatively high transfer sensitivities in the problematic 300-400 Hz range.
Digging deeper, the noise contributions from individual body attachment points are ranked. It becomes evident that the forces exciting the front of the vehicle are the main cause of the peaks of interest. Both the subframe attachment points and the direct suspension strut mounts to the body have a significant impact on road noise.
If we step back and consider what we have accomplished, it’s quite remarkable. The workflow we have used, which involves combining measurement data with simulation results in a virtual assembly, seems almost like magic. It allows us to identify the critical zone of the assembly with precision, and the work effort for creating this assembly is a few minutes. But we won’t stop there. Once we have identified the critical zone, we will take it a step further and determine the best approach to tackle the issue.
Sensitivity Analysis
With this workflow, we have the ability to rapidly test various alternatives within a matter of minutes. By making rather large changes to components (stiffness, damping, …), we can immediately assess if the component will impact the results. The efficient overall workflow allows to screen a large number of variants in a short time.
By considering the above results of the body attachment contributions, we are directing our investigation directly toward the subframe and front strut mount. Our objective is to evaluate how these components affect the road noise performance.
To evaluate the subframe, we test three different modifications: increasing stiffness, increasing damping, and reducing stiffness.
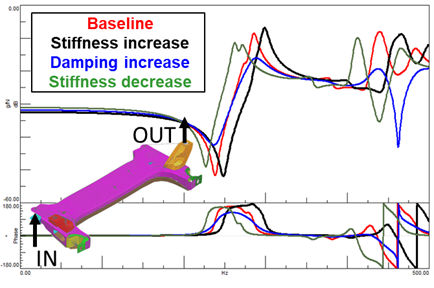
The effects of these modifications on the component Frequency Response Functions (FRFs) are examined. The FRFs very limited changes in peak location and amplitude, so is the impact on the driver’s ear sound pressure levels, with a reduction of around 1.5-2 dB(A) observed for the two key peaks of interest.
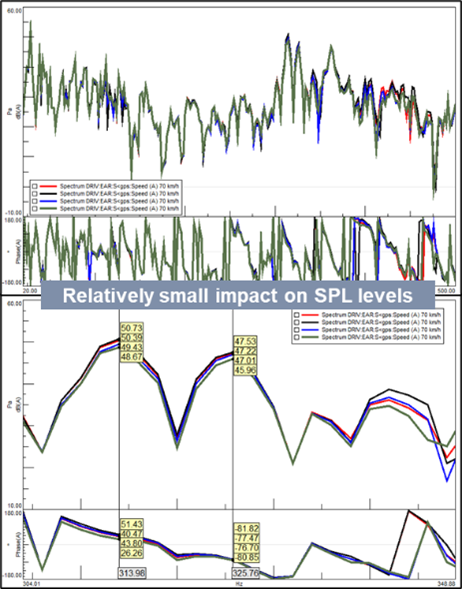
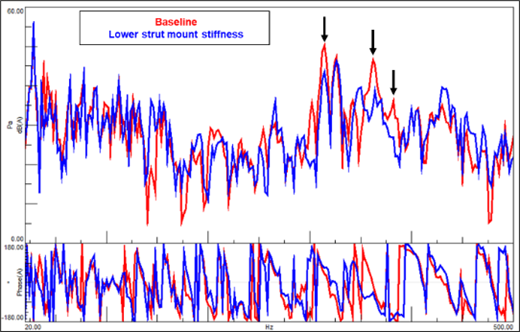
Next, we turn our attention to the front strut mount. By reducing its rotational stiffness, we investigate the impact on the driver’s ear sound pressure levels. We see that this modification not only significantly reduces one of the target peaks but also improves some higher frequency peaks.
The VPA process proves to be highly adaptable and efficient in implementing and evaluating these modifications. The results of the sensitivity analysis highlight the effectiveness of this process in troubleshooting and addressing NVH issues in the vehicle.
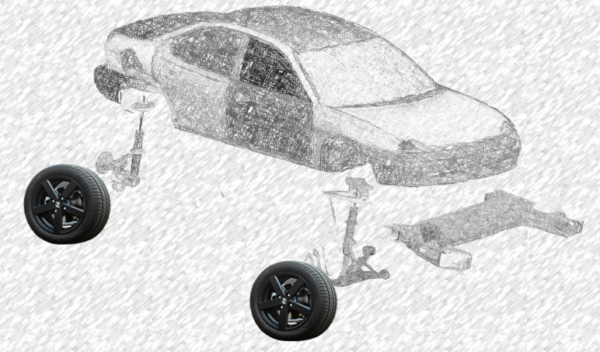
You probably have also witnessed some of the magic I mentioned. I find it impressive what can be achieved in NVH with virtual assemblies, particularly when the results guide us directly to the critical location of the vehicle that needs to be addressed. I think what was the most impressive to my son to couple real parts to virtual parts in the computer. There the image helped a lot.
If you want to explore further, please don’t hesitate to use the links below and contact us.
Discover our NVH prediction capabilities, and learn more about the theory of TPA and VPA in these links.
Want to know more about CAE test coupling? Check out the blog article below!


