No to Know VIP – Part 3
Thus far we have talked about the importance of having a VIP which is easy to connect to the DUT in part 1 and having the flexibility to configure the VIP as per your requirements and use the built-in or pre-packaged sequences in part 2. In this final part of the series, we will talk about the various built-in features of a VIP which helps with your debug.
If you have a UVM based testbench with one or multiple VIPs, your testbench could be more complex than your DUT and debugging this environment could be a major challenge. Debugging UVM VIP based environments could be thought of having 3 layers:
- UVM’s built-in debug mechanism
- Simulator with Class Based Debug
- VIP with built-in debug features
These are some of the features that Mentor’s VIP provide as built-in debug mechanisms:
VIP Query Commands:
These query commands provide the ability to query the state of the VIP in the testbench at any given time in a batch or CLI mode to get the summary of the VIP or the current configuration of the VIP and prints it to the simulation log.
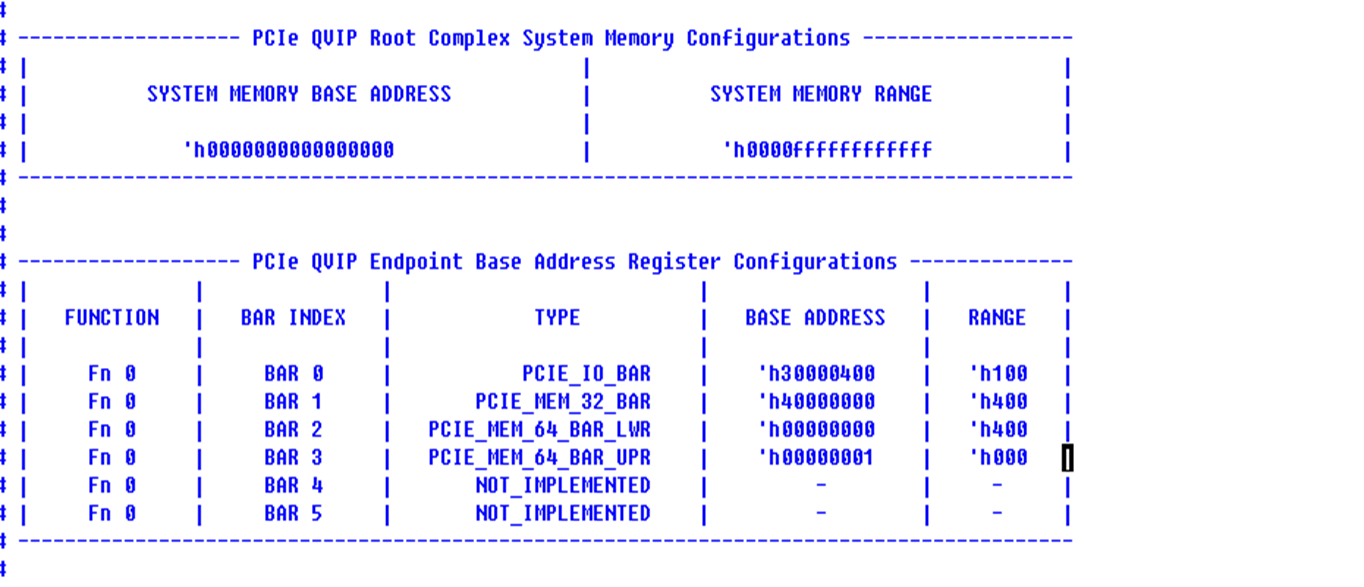
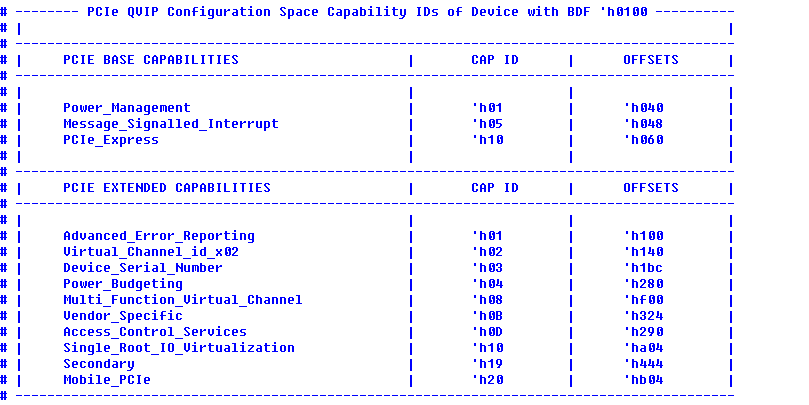
For example, in PCI Express, the VIP can output B.A.R. information, to show the addressing set up in the system (above) as well as the PCIe configuration space showing the device capabilities (below).
Error Messaging & Reporting:
Error Messaging is very important as this is the first thing the user checks while debugging. The error messages have proper encoding to differentiate between methodology errors, protocol errors and infrastructure errors. It also provides the flexibility of customizing the report message and logging mechanism.
Assertions:
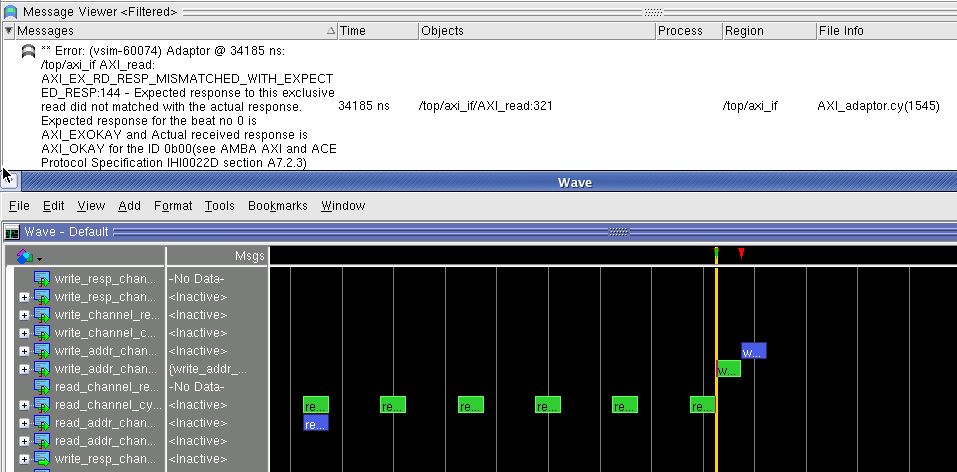
While the VIP is running, a built-in set of assertions check for any protocol violations to verify compliance with the specification. When these fire, they result in a message that can be printed to the transcript, or piped through the UVM reporting mechanism. The text of the message include the interface instance name, a description of what went wrong and a reference back to the specification to help when looking up further details. Each assertion error is configurable and can be enabled or disabled and have its severity level changed.
Protocol Debug:
Another important aspect of the VIP is to help with protocol debug. Mentor VIP is transaction based, and those transactions are available for creating stimulus as well as for analysis, where they can be used in the testbench for scoreboarding and coverage collection.
Transaction Logging:
Transactions can also be logged to a text file, printed out via the standard UVM print mechanism, or output to a tracker file by a provided analysis component. Following is the sample print of transaction log file that shows attribute information that is printed along with the format:
AXI Clk Cycle = 10.00 ns; AXI Clk Frequency = 100.00 MHz; Data bus width = 32 bits
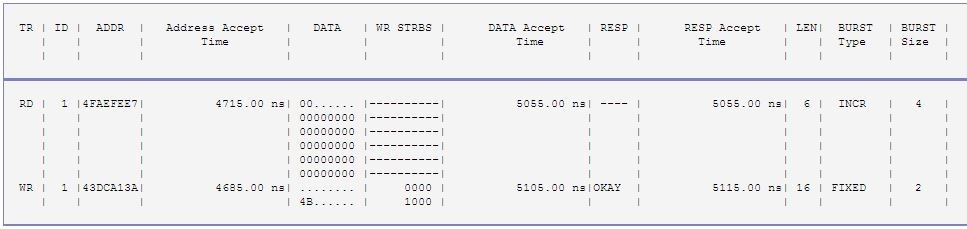
Here, transaction wise data is printed in the log file which includes whether transaction is read or write, ID of transaction, starting address, accept time of address phase, data of each beat, write strobes, data burst accept time, response of transaction, response phase accept time, length of transaction, burst type, and size of burst.
The VIP can also output text based log, or tracker files. This can typically be done at both the protocol level, and also at the symbol level for protocols such as PCI Express to help debug link training, or other state machines. Here we can see the symbols for an OS PLP transmission, a TLP transmission and a DLLP transmission on the bus.

Transaction Linking:
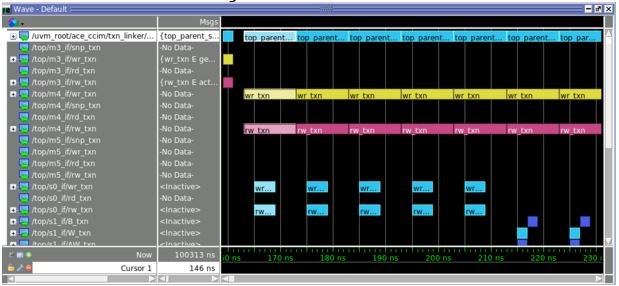
Just logging transactions isn’t sufficient while debugging a cache coherent interconnect (CCI). An originating master request transaction results in snoops to other cached masters and a slave access as needed. While debugging system level stimulus, it becomes difficult to identify which all snoop transactions are related to a specific originating request. A Cache Coherency Interconnect Monitor (CCIM), helps overcome this debugging issue by providing a transaction linking component that connects to all the interfaces around a CCI. CCIM provides a top-level parent sequence item that links to all related child sequence items, such as originating request, snoop to cached masters, and slave access.
Protocol Stack Debug:
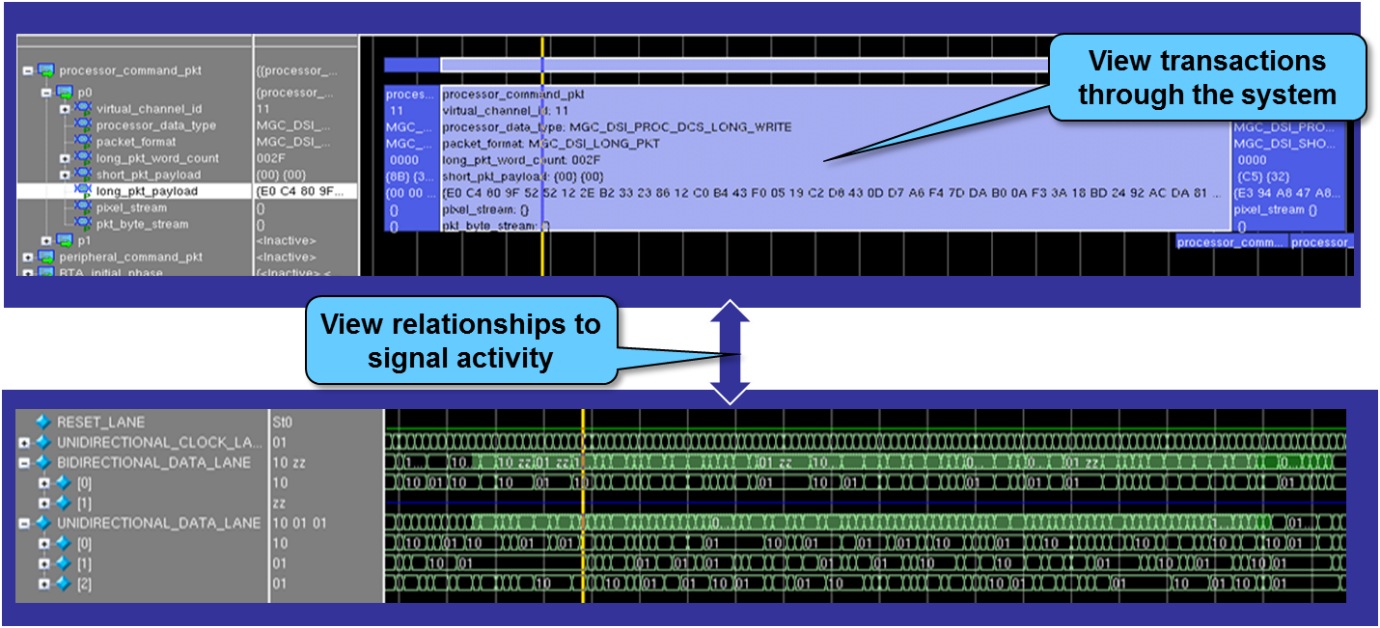
Along with the transactions, the VIP also records relationship information, relations to other transactions through the protocol stack and also to the signals themselves. This allows you to quickly move from transaction, to signal level debug, and highlight not just which signals, but also the time at which those signals participated in any given transaction.
I hope this series has provided you with few insights into what makes a VIP easy to instantiate, connect, configure and start driving stimulus. I would really like to hear about your VIP usage experiences.