Road noise engineering: how do virtual points simplify tire performance characterization?
What began as a ripple has grown into an unstoppable wave. Electrified vehicles are taking over the automotive market at a drastically accelerating rate. It is expected that by 2030, more than half of car sales in the US will be electric. Together with this shift in market demand, many automotive manufacturers are pivoting to the development of electrified vehicles to supplement or even replace their combustion-driven models. For NVH engineers, this will result in an increased focus on road noise engineering for future vehicles.
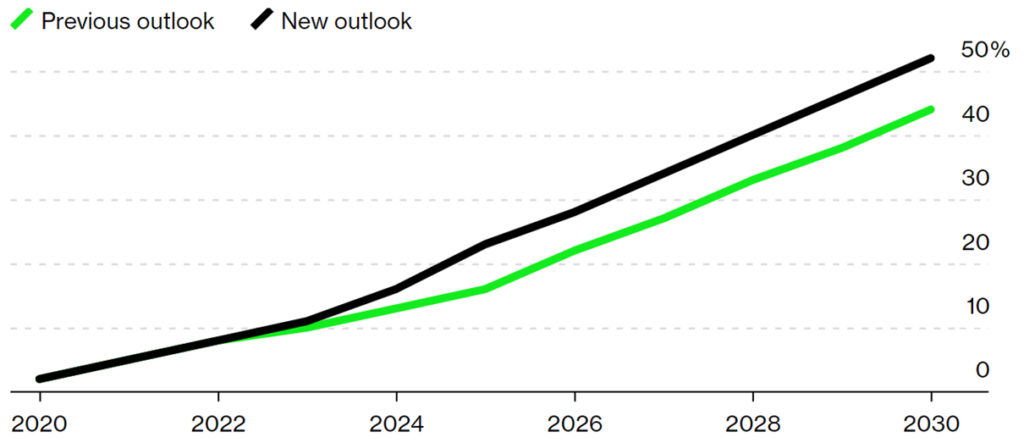
Source: BloombergNEF
One of the key quality criteria in developing a new vehicle is NVH performance. Unfortunately for NVH engineers, the NVH performance of electrified vehicles is more challenging to optimize than its combustion-driven counterparts. This is because customers tend to focus their attention on a much broader range of noise sources (wind, road, powertrain, auxiliaries, …) in the absence of a dominating noisy powertrain.
Among this broad range of sources, road noise is the dominant noise source in EVs at low vehicle speeds and thus a primary focus area for NVH engineers. Unfortunately, road noise itself is also quite challenging to optimize as it strongly depends on how multiple components (tires, wheels, suspension system, chassis, …) interact. This explains why road noise engineering particularly requires excellent collaboration between the teams responsible for each of these components at OEMs or suppliers.
In this article, we will take the viewpoint of an automotive tire supplier. What is the most effective way to characterize our tire’s road noise performance so that an OEM can reach their vehicle-level NVH targets?
Divide and conquer
Both OEMs and suppliers are increasingly looking at Component-based Transfer Path Analysis (C-TPA) as the technology to improve collaboration between engineering teams. With C-TPA, each component that contributes to a vehicle-level NVH target can be independently characterized in a simplified component model containing only loads and transfer functions. The next step is Virtual Prototype Assembly (VPA), where component models are assembled into virtual vehicle prototypes for which the NVH performance can be predicted.
The VPA approach offers many advantages, but one of the most significant is that it indisputably separates the responsibilities of OEMs and suppliers. For example, if a tire supplier can guarantee that the road loads and impedance at the interface to the suspension system stay below a target threshold, then the OEM only needs to consider the suspension system and chassis design to reach a target vehicle-level road noise performance.
Better tire component models using virtual points
Let’s say that we want to characterize a tire’s road noise performance using a simplified component model. Which input data would we need for that? Referring to the technical background of C-TPA:
- Road loads (described as blocked forces) at the interface to the suspension system
- Impedance Frequency Response Functions (FRFs) at the interface to the suspension system
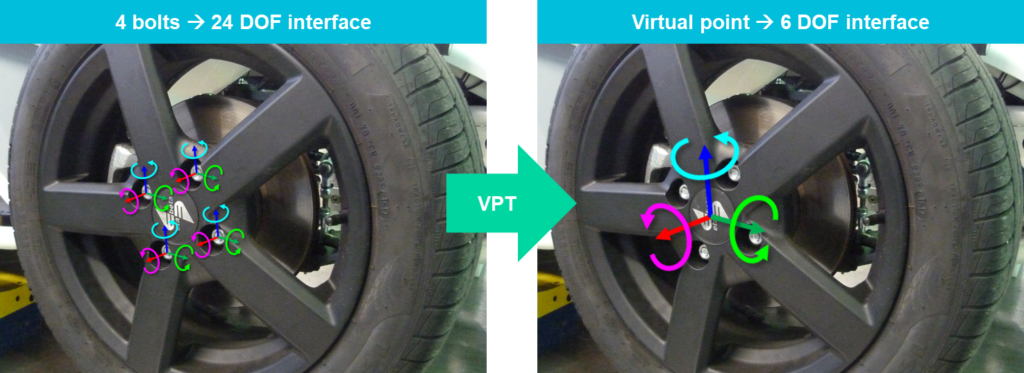
This is easier said than done! Consider for a moment that the physical interface to the suspension system is 4 – 5 bolts rigidly connecting the wheel to the wheel hub and that a comprehensive set of road loads includes all 6 translational and rotational degrees of freedom (DOFs) for a total of 24 – 30 unique blocked forces and moments. As the bolts are often closely spaced, this will lead to significant numerical stability issues when estimating these blocked forces and moments using common techniques like in-situ TPA!
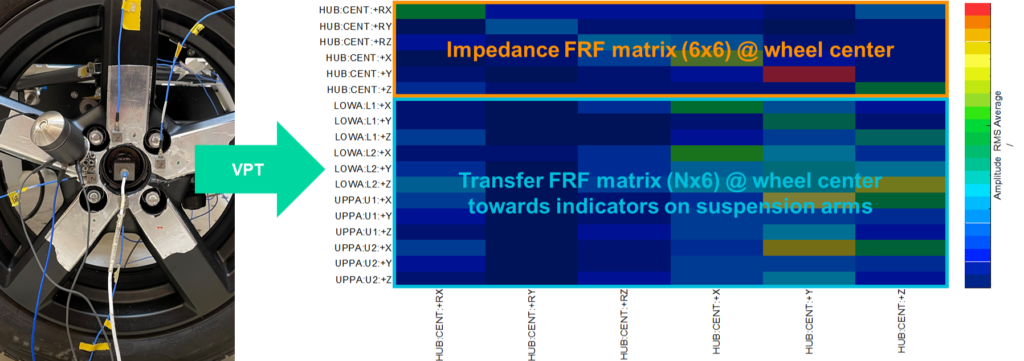
The solution is to simplify the interface using a technique called Virtual Point Transformation (VPT). In short: if we can assume that the measured structure is locally rigid, then we can transform any measurement result to an arbitrarily chosen virtual point using only geometric relationships between the measurement points and virtual point. This allows us to simplify the interface to a single virtual point (typically at the wheel center) with only 6 DOFs, significantly improving the numerical stability and accuracy of the load estimation.
How to kill two birds with one stone using CAD
VPT is the key to simplifying tire component models to a virtual point source at the wheel center, but its accuracy is determined by how precisely we can obtain the geometric relationships between the measurement points and the virtual point. So, is it time to get out your ruler and protractor?
In our digital age, a better alternative would be to virtually prepare the instrumentation on a CAD geometry instead. In addition to automatically extracting precise sensor coordinates and orientations, CAD geometries also provide much more freedom in preparing the instrumentation compared to manually aligning sensors to predefined coordinate systems.
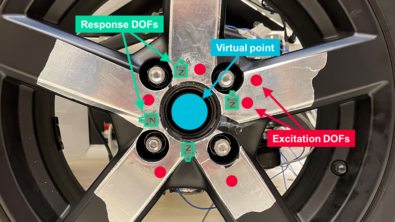
Let’s look at an example. I have a physical setup with 4 response locations, 6 excitation locations, and a virtual point at the wheel center.
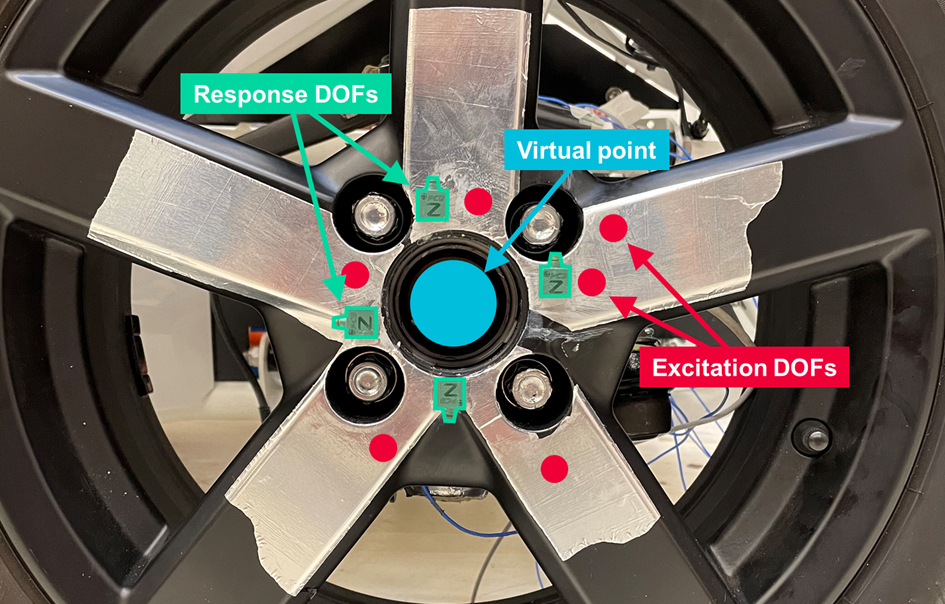
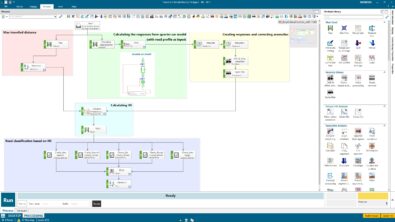
In Simcenter Testlab I can load a CAD geometry of my setup, add sensors from my library, and fine-tune their positions until I am satisfied with the result.
Wait a minute, who invited the hedgehog?
While we are free to choose any sensor locations we want, the final setup must capture all 6 DOFs of the virtual point. For response DOFs this is easy: triaxial accelerometers can measure in any direction where they are attached. What about excitation DOFs though?
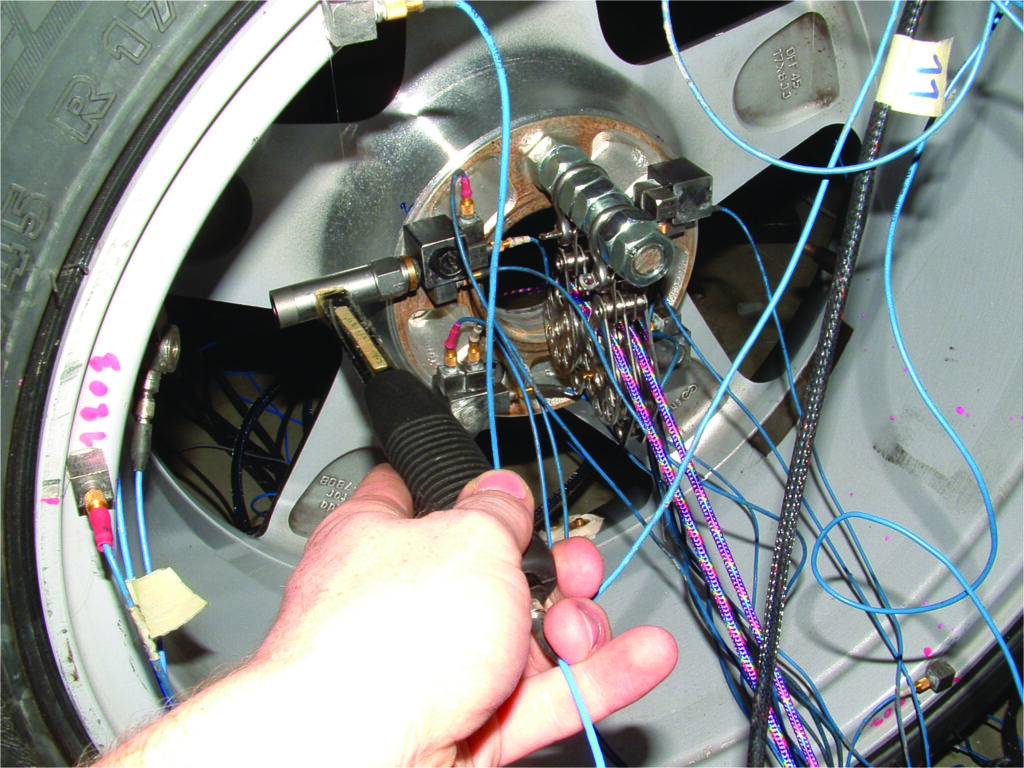
When using an impact hammer, often only directions normal to the structure’s surface are easily accessible. Exciting in-plane directions usually requires a support block to be attached first. While practical, this solution is not ideal as it introduces mass loading (the support block must be sufficiently rigid) and parasitic moment excitation (due to the offset introduced by the support block).
With shaker excitation, a better alternative is to use the Simcenter Qsources Q-TRX in-plane excitation adapter. After this strangely hedgehog-looking device is glued to the desired excitation location, a Q-ISH Integral Shaker can be screwed into any of the threaded inserts to consistently excite in both normal and in-plane directions.
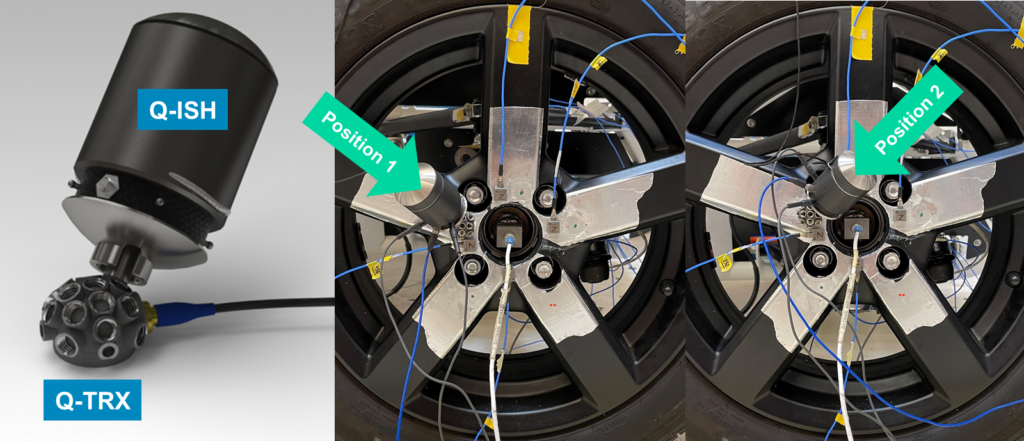
Compared to the support block method, the Q-TRX minimizes mass loading with its hollow but stiff shell and eliminates parasitic moment excitation by avoiding any excitation offset.
What did all this achieve?
It’s time to collect our measurement data and create the tire component model.
Using VPT, we can transform all transfer functions measured with the Q-TRX in-plane excitation adapter to our virtual point at the wheel center. The result is a transformed impedance FRF matrix (used to predict coupling effects between the wheel and wheel hub) and a transformed transfer FRF matrix (used to estimate loads using in-situ TPA and to predict target responses).
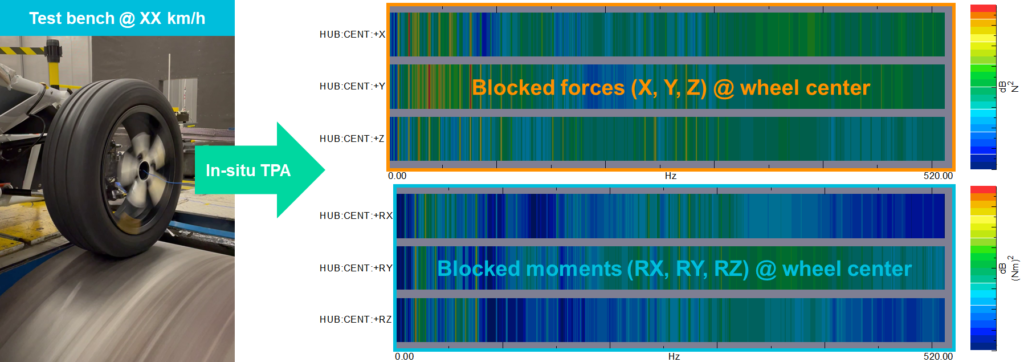
Using in-situ TPA, we can combine the transformed transfer FRF matrix with operational indicator data measured on a tire test bench to obtain the blocked forces and moments at the wheel center for any vehicle speed.
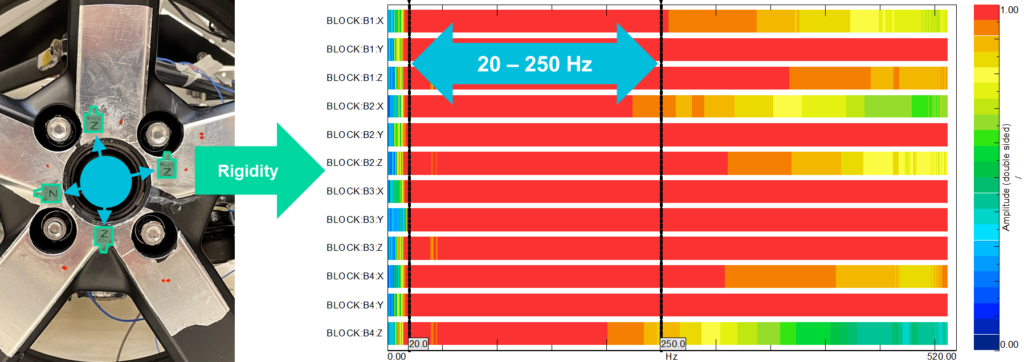
Finally, we can verify the accuracy of our results using several quality metrics built into Simcenter Testlab. For example, the Rigidity metric can be used to verify how well the assumption of local rigidity (a prerequisite for applying VPT) holds in practice. In our case, the Rigidity between the virtual point and response points starts dropping sharply after 250 Hz for some directions. Repositioning these response points may improve the frequency range where VPT can be applied.
Where to go from here?
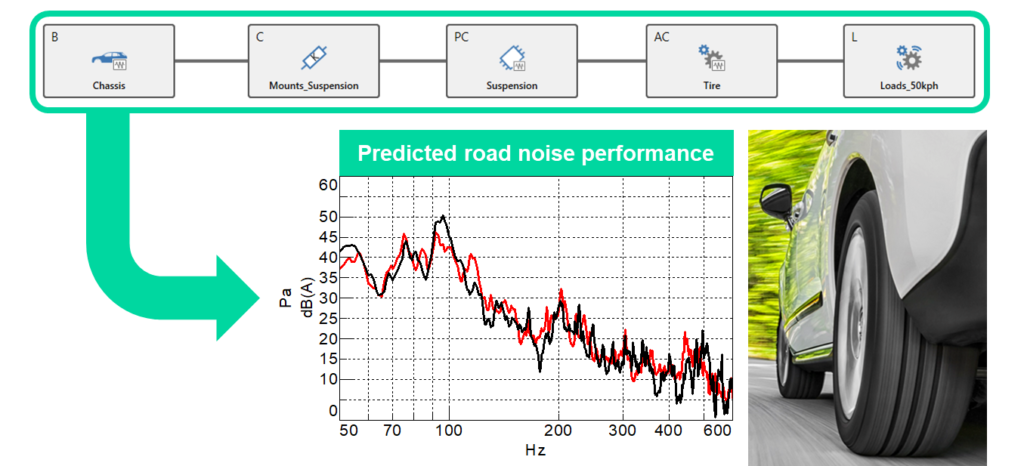
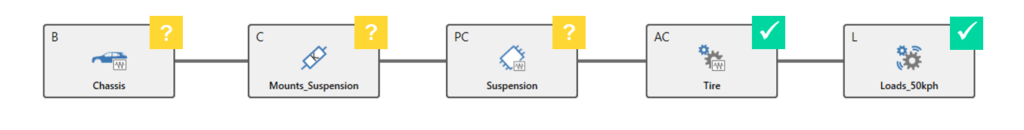
The beauty of Virtual Prototype Assembly (VPA) is that this is where the responsibilities of the tire supplier end. Once the tire component model has been created, it can be shared with OEMs who can virtually assemble it with their own component models to predict the road noise performance of a virtual vehicle prototype.
Perhaps you are curious about how the story continues from the viewpoint of an automotive OEM? Learn more about how Hyundai Motor Group has implemented VPA in their NVH development process to make timely and reliable improvements during the early stages of vehicle development.