Conclusion: The 2014 Wilson Research Group Functional Verification Study
Impact of Design Size on First Silicon Success
This blog is a continuation of a series of blogs related to the 2014 Wilson Research Group Functional Verification Study (click here). In my previous blog (click here), I present verification results findings in terms of schedules, number of required spins, and classification of functional bugs. In this blog, I conclude the series on the 2014 Wilson Research Group Functional Verification Study by providing a deeper analysis of respins by design size.
It’s generally assumed that the larger the design—the increased likelihood of the occurrence of bugs. Yet, a question worth answering is how effective projects are at finding these bugs prior to tapeout.
In Figure 1, we first extract the 2014 data from the required number of spins trends presented in my previous blog (click here), and then partition this data into sets based on design size (that is, designs less than 5 million gates, designs between 5 and 80 million gates, and designs greater than 80 million gates). This led to perhaps one of the most startling findings from our 2014 study. That is, the data suggest that the smaller the design—the less likelihood of achieving first silicon success! While 34 percent of the designs over 80 million gates achieve first silicon success, only 27 percent of the designs less than 5 million gates are able to achieve first silicon success. The difference is statistically significant.
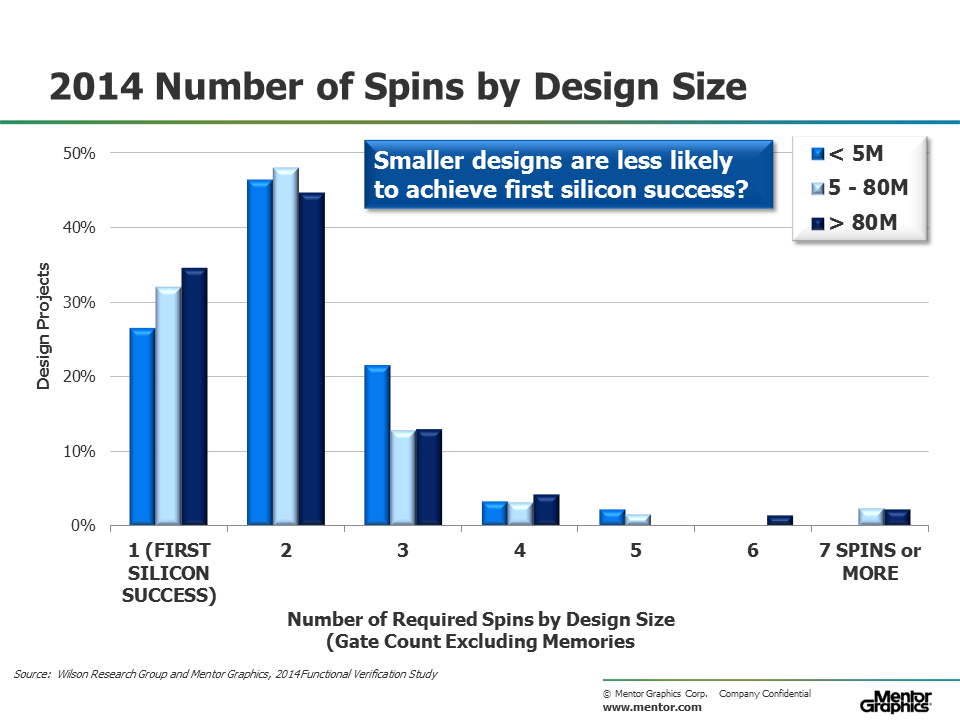
Figure 1. Number of spins by design size
To understand what factors might be contributing to this phenomena, we decided to apply the same partitioning technique while examining verification technology adoption trends.
Figure 2 shows the adoption trends for various verification techniques from 2007 through 2014, which include code coverage, assertions, functional coverage, and constrained-random simulation.
One observation we can make from these adoption trends is that the electronic design industry is maturing its verification processes. This maturity is likely due to the need to address the challenge of verifying designs with growing complexity.
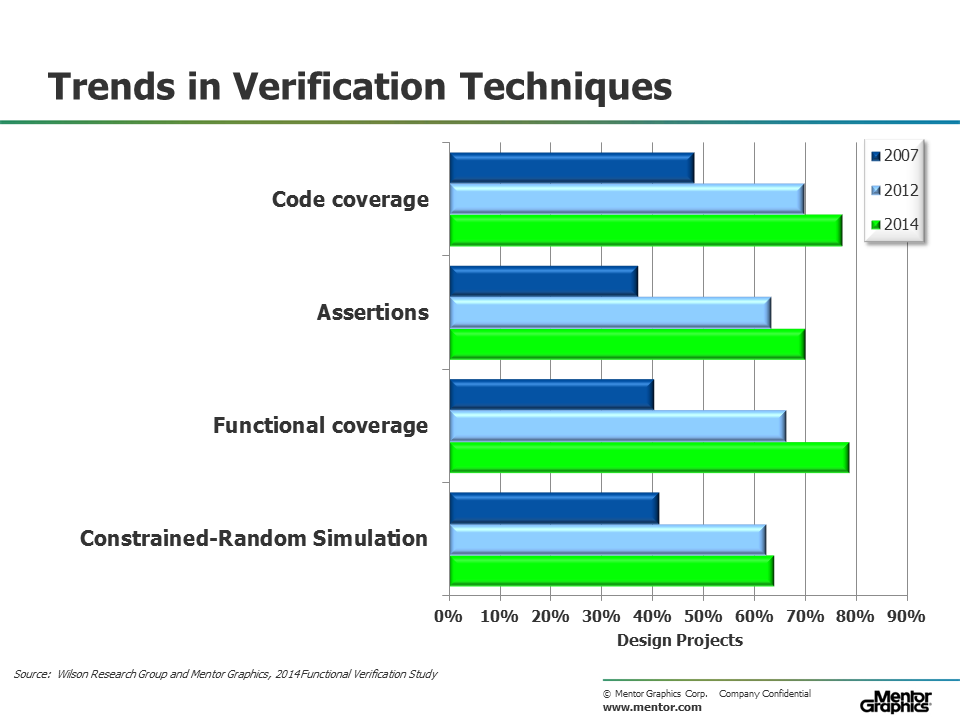
Figure 2. Verification Technology Adoption Trends
In Figure 3 we extract the 2014 data from the various verification technology adoptions trends presented in Figure 2, and then partition this data into sets based on design size (that is, designs less than 5 million gates, designs between 5 and 80 million gates, and designs greater than 80 million gates).
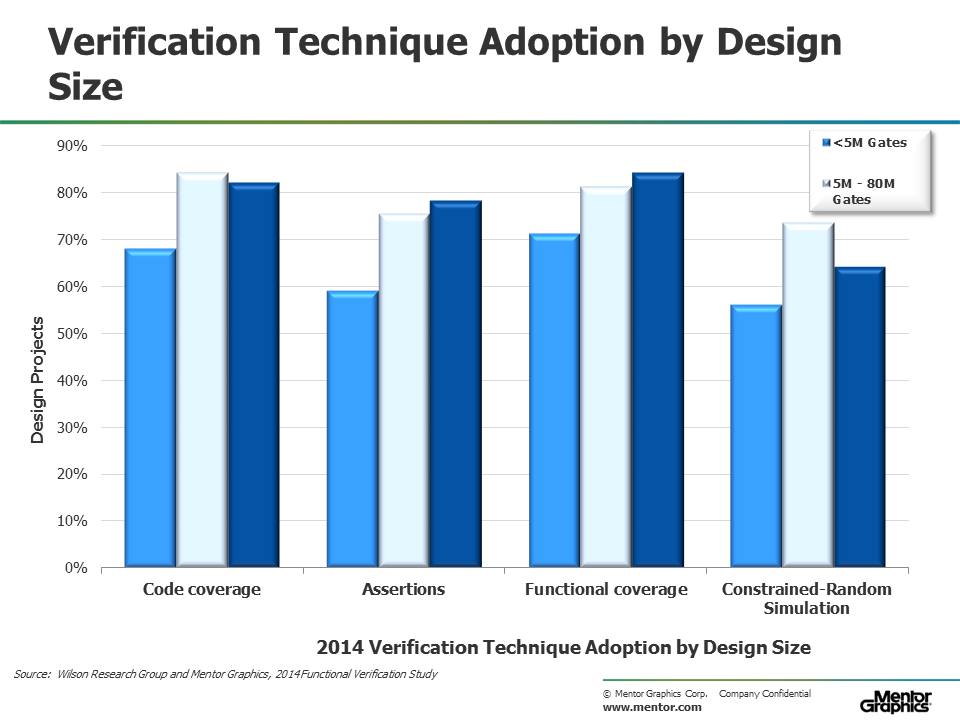
Figure 3. Verification Technology Adoption by Design
Across the board we see that designs less than 5 million gates are less likely to adopt code coverage, assertions, functional coverage, and constrained-random simulation. Hence, if you correlate this data with the number of spins by design size (as shown in Figure 1), then the data suggest that the verification maturity of an organization has a significant influence on its ability to achieve first silicon success.
As a side note, you might have noticed that there is less adoption of constrained-random simulation for designs greater than 80 million gates. There are a few factors contributing to this behavior: (1) constrained-random works well at the IP and subsystem level, but does not scale to the full-chip level for large designs. (2) There a number of projects working on large designs that predominately focuses on integrating existing or purchased IPs. Hence, these types of projects focus more of their verification effort on integration and system validation task, and constrained-random simulation is rarely applied here.
So, to conclude this blog series, in general, the industry is maturing its verification processes as witnessed by the verification technology adoption trends. However, we found that smaller designs were less likely to adopt what is generally viewed as industry best verification practices and techniques. Similarly, we found that projects working on smaller designs tend to have a smaller ratio of peak verification engineers to peak designers. Could the fact that fewer available verification resources combined with the lack of adoption of more advanced verification techniques account for fewer small designs achieving first silicon success? The data suggest that this might be one contributing factor. It’s certainly something worth considering.
Quick links to the 2014 Wilson Research Group Study results
- Prologue: The 2014 Wilson Research Group Functional Verification Study
- Understanding and Minimizing Study Bias
- Part 1 – FPGA Design Trends
- Part 2 – FPGA Verification Effort Trends
- Part 3 – FPGA Verification Effort Trends (Continued)
- Part 4 – FPGA Verification Effectiveness Trends
- Part 5 – FPGA Verification Technology Adoption Trends
- Part 6 – FPGA Verification Language and Library Adoption Trends
- Part 7 – ASIC/IC Design Trends
- Part 8 – ASIC/IC Resource Trends
- Part 9 – ASIC/IC Verification Technology Adoption Trends
- Part 10 – ASIC/IC Language and Library Adoption Trends
- Part 11 – ASIC/IC Power Management Trends
- Part 12 – ASIC/IC Verification Results Trends
- Conclusion: The 2014 Wilson Research Group Functional Verification Study


Comments
Leave a Reply
You must be logged in to post a comment.
This whole series of articles were very interesting. Need more on first silicon success practices from verification point of view.