UVM Testbench Debug – A Day At The Beach – Right?

Some people think UVM Testbench Debug is a drag. But really, it depends. I think it’s a day at the beach. At my house, summer is definitely over but we’re still getting a declining number of “summer hot” days – without the benefit of the beach. This summer we spent some time doing nothing much at the beach. But it’s hard to shut it all down – I kept thinking about how debug is like a day at the beach… Pleasant. Breezy. Just easy. Until I found some sand in my sandwich. I suppose that’s UVM Testbench Debug too. Pleasant. Breezy. Just easy. Until it is impossible.
Then you grind your teeth debugging the UVM Testbench, just like at the beach with the sandy sandwich.
Break-on-Change
Using good tools can help minimize the UVM Testbench Grinding. Specifically, I’m thinking about the case where some groups have integrated their new testbench code – checkers, models, sequences, sequence items, the whole shebang.
The integrated parts came into the testbench, and you notice that a class member variable is being changed by some part of the testbench. But you have no idea. You can’t back out the integrated pieces.
In the example below, a distribution is randomized for “nibble values” in a data packet. Ah ha! Some integrator is trying to force a desired distribution and is modifying the randomized distribution.
You’re sure it must be the last person who integrated their stuff. But proving it is another thing.
Who Changed That Variable?
This will be easy to debug with Visualizer Debug Environment. Run the live simulation and break where the variable is declared.
Set a “break on change”, then run until a change is detected.
- Select the variable (nibble_dist), Right-Mouse-Button, then Add Break on Change.
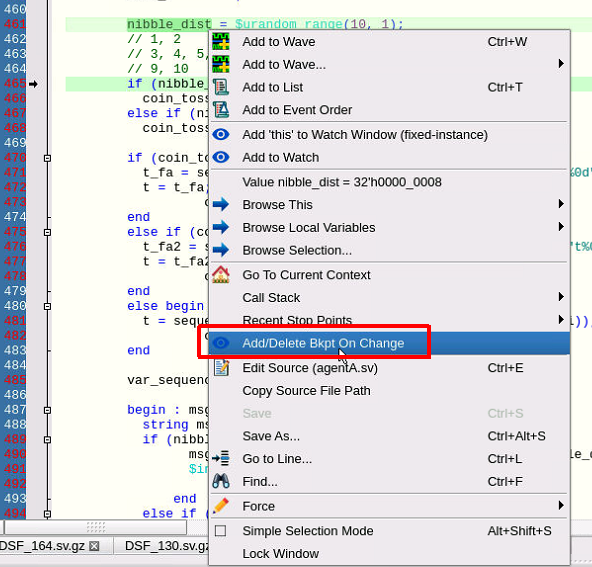
- Now press ‘run’ to run until the break-on-change or watchpoint is hit. When it is hit, then the line above is the line that changed the variable.
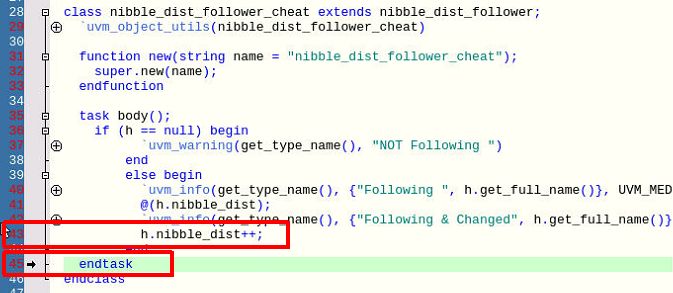
The watchpoint above triggers when the variable is changed. We stop on the next line. Now we find out who wrote the ‘nibble_dist_follower_cheat’ class, and what their intentions are. That code sits there and waits for nibble_dist to be set and then increments it. What’s up with that?
Break-on-change found this issue immediately.
Derived Classes – Who Made These?
A driver can receive sequence items generated by sequences. As integrations happen, more sequences may be added. More sequence items. Derived classes – you know – Polymorphic classes. I sometimes call derived classes “better classes” – since they have some additional property or behavior not included in the base class – or they improve the built-in behavior. But the idea is the same. The derived class is a perfectly fine class to send to the driver, but it is unknown to the original testbench writer or integrator (me).
These “out-of-the-blue” classes got added by the various integrated parts. Thank you.
What to do? Easy.
Source code hover or watch window
In the driver, set a breakpoint right after the get_next_item(t) call. See image below. When the breakpoint is hit, hover over the ‘t’. See the class type name. Or put ‘t’ in the watch window.
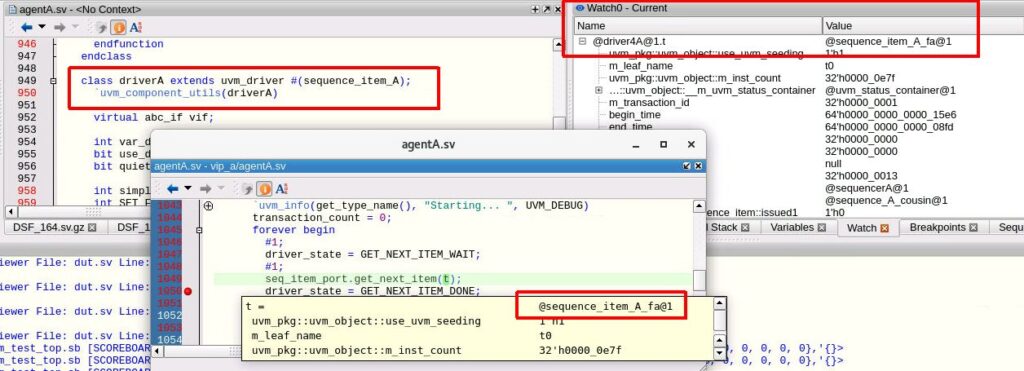
QuestaSim builds object handles in a regular way – it names the object “@CLASS_NAME@NUMBER”, where the CLASS_NAME is the declared class name of this constructed object and NUMBER is the number of times this class has been constructed. Really easy to see what class type an object is – just get the handle.
Wave Window
Or maybe easier – put the ‘t’ variable in the wave window, and see ALL the transactions that go through the driver – and see their type name and their attributes – base class attributes and derived class attributes.
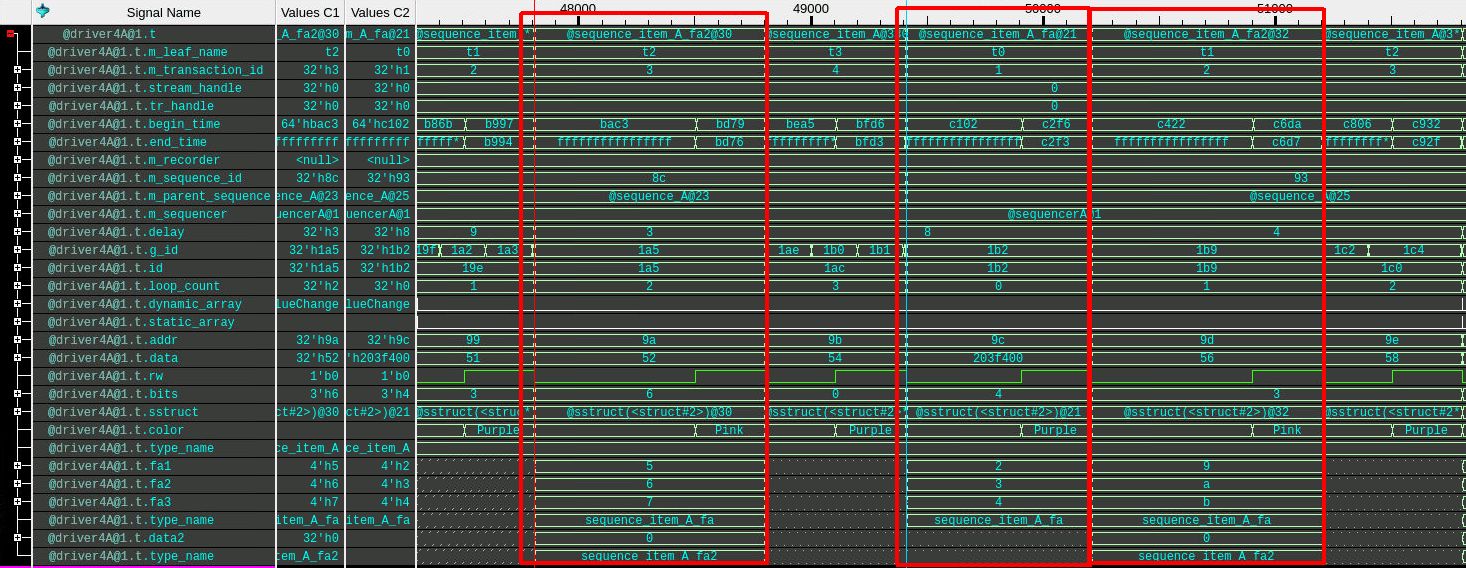
The three red boxes above are derived classes – left-to-right – sequence_item_A_fa2, sequence_item_A_fa and another sequence_item_A_fa2. They have a different number of attributes shown since they are “better sequence_item_A” classes – they’ve added properties (class member variables).
Mystery solved another way and immediately.
End
Using tools to solve problems seems obvious. Use the proper tools – or get the right one. Just because you own a hammer, doesn’t make every problem a nail. Using the right tool makes solving the problem more like a day at the beach. Just use the tool – adjust the beach umbrella and sit back and relax.
My question – what’s the right tool to remove sand from your sandwich at the beach?
Do you just eat the sandwich and chew through the sand?
Or do you give up and go to the snack shack and get an ice cream sandwich?
I chose the latter. Easy.
Happy Debugging – and I hope you get to your “beach” soon.
Name that beach in the introductory picture – 10,000 gold stars in the next BLOG for you.

