Prologue: The 2018 Wilson Research Group Functional Verification Study
This is the first in a sequence of blogs that presents the findings from our new 2018 Wilson Research Group Functional Verification Study. Similar to my previous 2016 Wilson Research Group functional verification study blogs, I plan to begin this sequence of blogs with an exclusive focus on FPGA trends. Why? For the following reasons:
- Some of the more interesting trends in our 2018 study are related to FPGA designs.
- The FPGA market has a difficult time with non-trivial bug escapes into production.
- The FPGA market is rapidly maturing its verification processes to address growing complexity.
- The IC/ASIC market has converged on common processes driving by maturing industry standards.
- The IC/ASIC market is fairly mature in its adoption of various verification technology and techniques for IP and subsystem verification. Many of the new IC/ASIC challenges have moved to the system level.
Study Overview
The study results presented in this paper are a continuation of a series of industry studies on functional verification. This series includes the previously published 2014 and 2016 Wilson Research Group Functional Verification Study [3][4]. Each of these studies was modeled after the 2002 and 2004 Collett International Research, Inc. studies [1][2] and focus on the IC/ASIC market. While we began studying the FPGA market in 2012, we waited until we had sufficient multi-year data points to identify verification trends to draw any significant conclusions.
For the purpose of our study, the sampling frame was constructed from eight industry lists that we acquired. This enabled us to cover all regions of the world and all relevant electronics industry market segments. It is important to note that we did not include our own account team’s customer list in the sampling frame. This was done in a deliberate attempt to prevent vendor bias in the final results. While we architected the study in terms of questions and then compiled and analyzed the final results, we commissioned Wilson Research Group to execute our study. After data cleaning the results to remove inconsistent, incomplete, or random responses, the final sample size consisted of 1205 eligible and qualified participants (i.e., n=1205).
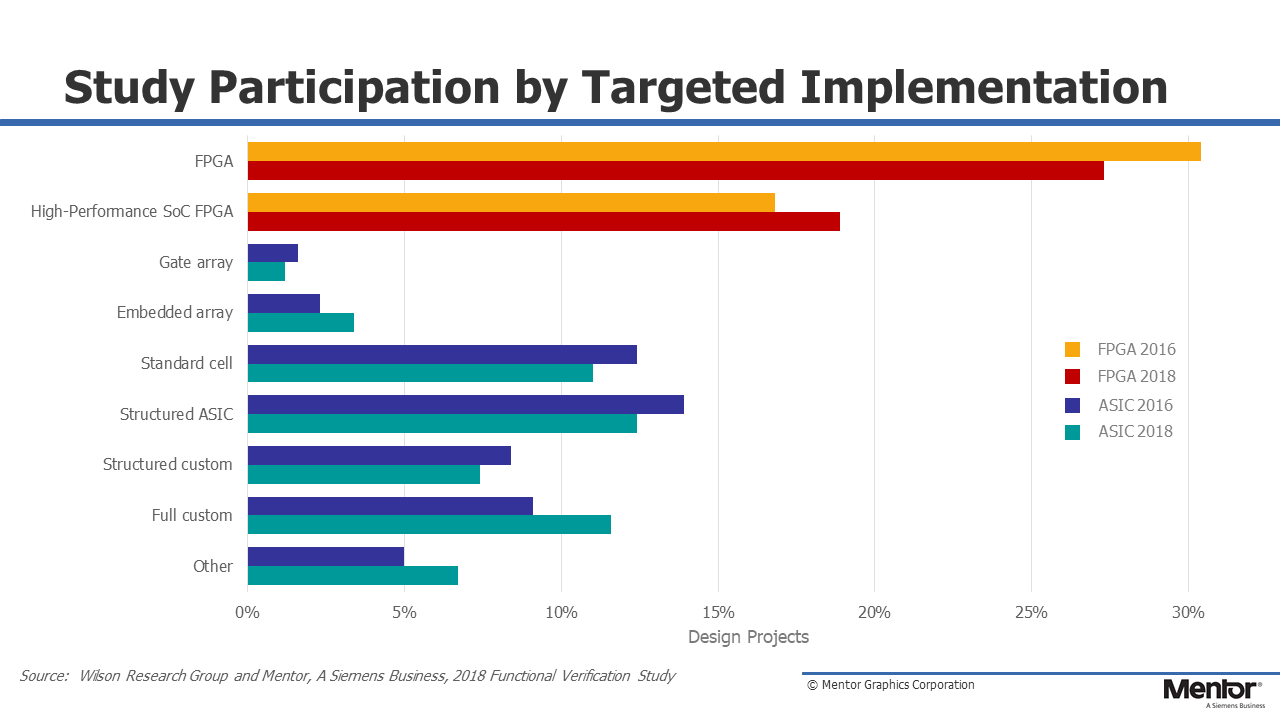
Figure 1: Study participants by targeted implementation
Figure 1 compares the percentage of 2016 and 2018 study participants (i.e., design projects) by targeted implementation for both IC/ASIC and FPGA projects. It is important to note that targeted implementation does not represent silicon volume in terms of the global semiconductor market since a single project could account for a significant portion of semiconductor market revenue. However, the data suggest that projects creating designs targeted at high-performance SoC programmable FPGAs is increasing, which is one indication of growing FPGA complexity.
Confidence Interval
Since all survey-based studies are subject to sampling errors, we attempt to quantify this error in probabilistic terms by calculating a confidence interval. For our study, we determined the overall margin of error to be ±4% using a 95% confidence interval. In other words, this confidence interval tells us that if we were to take repeated samples from a population, 95% of the samples would fall inside our margin of error ±4%, and only 5% of the samples would fall outside.
Study Participants
This section provides background on the makeup of the study.
The 2018 Wilson Research Group studies were worldwide studies. The regions targeted were:
- North America
- Europe
- Mideast
- Africa
- Pacific Rim/Asia
- India
The survey results are compiled both globally and regionally for analysis. In this blog sequence we will present the global trends.
Figure 2 shows the percentage of overall study FPGA and IC/ASIC participants by market segment. It is important to note that this figures does not represent silicon volume by market segment.
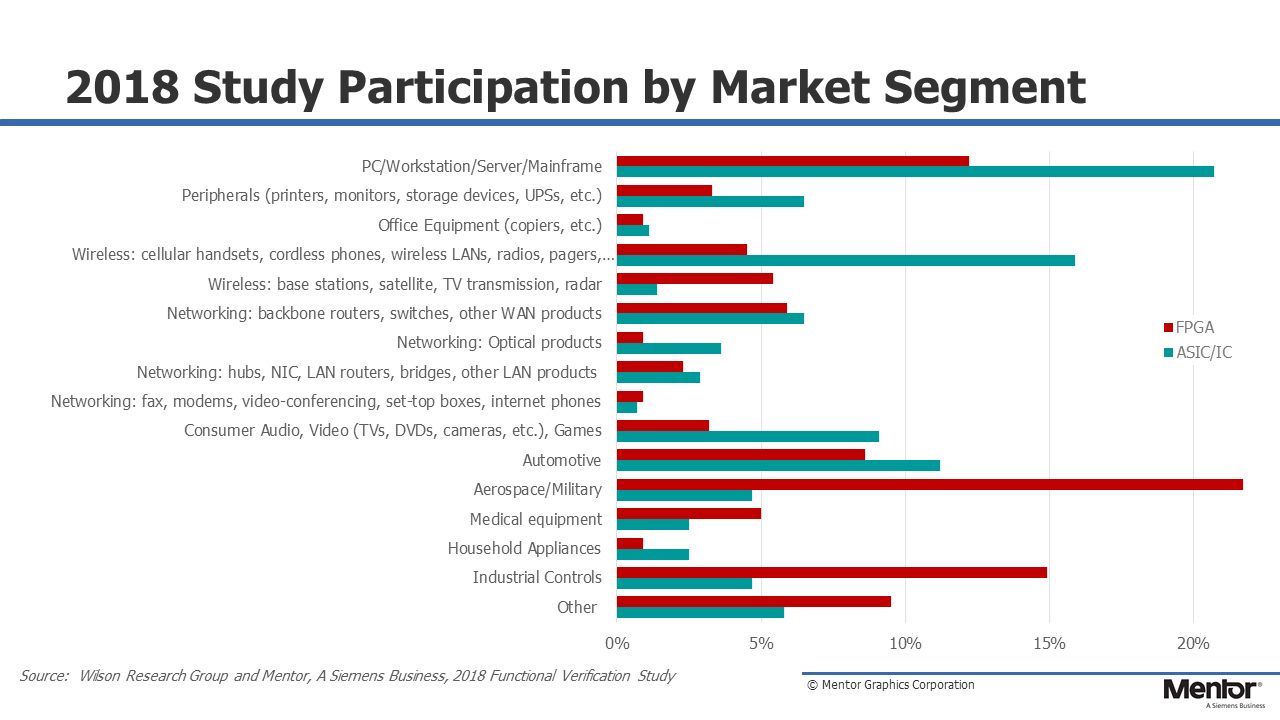
Figure 2: FPGA and IC/ASIC study participants by market segment
Figure 3 shows the percentage of overall study eligible FPGA and IC/ASIC participants by their job description. An example of eligible participant would be a self-identified design or verification engineer, or engineering manager, who is actively working within the electronics industry. Overall, design and verification engineers accounted for a majority of the study participants.
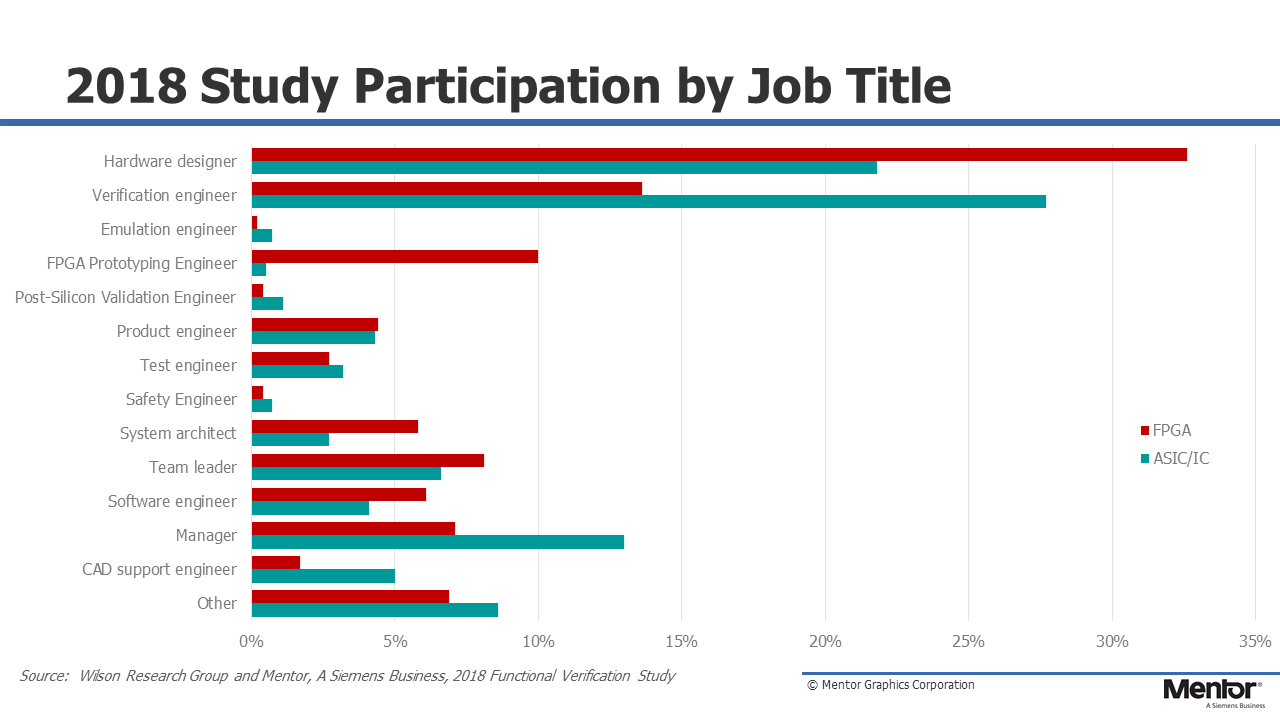
Figure 3: FPGA and IC/ASIC study participants’ job title description
Before I start presenting the findings from our 2018 functional verification study, I plan to discuss in my next blog (click here) general bias concerns associated with all survey-based studies—and what we did to minimize these concerns.
Quick links to the 2018 Wilson Research Group Study results
- Prologue: The 2018 Wilson Research Group Functional Verification Study
- Understanding and Minimizing Study Bias (2018 Study)
- Part 1 – FPGA Design Trends
- Part 2 – FPGA Verification Effectiveness Trends
- Part 3 – FPGA Verification Effort Trends
- Part 4 – FPGA Verification Effort Trends (Continued)
- Part 5 – FPGA Verification Technology Adoption Trends
- Part 6 – FPGA Verification Language and Library Adoption Trends
- Part 7 – IC/ASIC Design Trends
- Part 8 – IC/ASIC Resource Trends
- Part 9 – IC/ASIC Verification Technology Adoption Trends
- Part 10 – IC/ASIC Language and Library Adoption Trends
- Part 11 – IC/ASIC Power Management Trends
- Part 12 – IC/ASIC Verification Results Trends
- Conclusion: The 2018 Wilson Research Group Functional
References
[1] R. Collett, “2002 IC/ASIC functional verification study,” Industry Report from Collett International Research, Inc. 2003.
[2] R. Collett, “2004 IC/ASIC functional verification study,” Industry Report from Collett International Research, Inc. 2005.
[3] H. Foster, Trends in functional verification: a 2014 industry study, Proceedings of the 52nd Annual Design Automation Conference (DAC), June 07-11, 2015, San Francisco, California.
[4] H. Foster, Trends in functional verification: a 2016 industry study, DVCon 2017, San Jose, California.
