UVM Debug. A contest using class based testbench debug…
Still having fun doing UVM and Class based debug?
Maybe a debug contest will help. I had a contest with a user not too long ago.
We’ll call him Bob. Bob debugged his UVM testbench using that favorite technique – “logfile” debug. He spent a lot of time inserting, moving and removing $display statements, all while re-running simulation over and over. He’d generate a logfile, analyze it (read: run or tuneup a Perl script) and cross-check with waveforms and source code. He’d get close, only to realize he needed more $display. More Simulation.
Hopefully, just one more $display in one more file… More simulation… Repeat…
He wanted to know if there was a better way to climb around through his UVM Testbench.
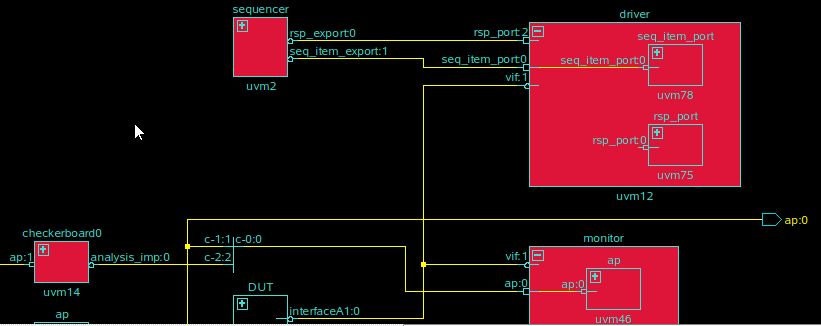
<UVM Agent Schematic – One way to climb around>
A Better Way to debug Bob’s Testbench – The Contest!
Bob challenged me to a contest. He wanted to know how fast we could find the bug using Mentor’s Visualizer™ Debug Environment and a post simulation database. One simulation. One shot.
We ran Bob’s simulation, capturing the waveform database. Generating that database required two extra switches:
vopt -debug +designfile …
vsim -qwavedb=+signal+class …
Then we ran the debugger in post-simulation mode:
visualizer +designfile +wavefile
When Bob first saw his RTL signals AND his UVM Class based testbench in the waveform window together, he got a big smile – literally getting up out of his seat.
Our contest was this. Who would be fastest to find the bug? Logfile debug or class based debug? This contest was all hindsight. Bob had already figured out what the bug was and had fixed it before we ever met. In the end the bug was a simple coding mistake in the way that a SystemVerilog queue was being used. Just a simple coding error. But I’m getting ahead of myself.
Digging through the testbench
We setup a remote link so that we both could see the post simulation debug session. Bob provided clues about the design and I drove the debugger.
We chased class handles around his design, from driver, across to monitor and into the scoreboard where the problem existed. There was a failure where a transaction contained N sub-transactions. The last two sub-transactions had errors, but only for a certain kind of transaction. And the error happened very late in an otherwise fully functional simulation.
<A UVM Driver transaction with derived classes and the parent sequence>
We started at the driver that was driving that transaction. We looked at the sequence_item that the driver received. But we had no idea from looking at the driver source code, what the ACTUAL type of the sequence_item was. Some derived type sequence_item was coming through. We also had no idea which sequence was generating this transaction. There were many sequences running on this driver.
![]()
<UVM Class Inheritance Diagram>
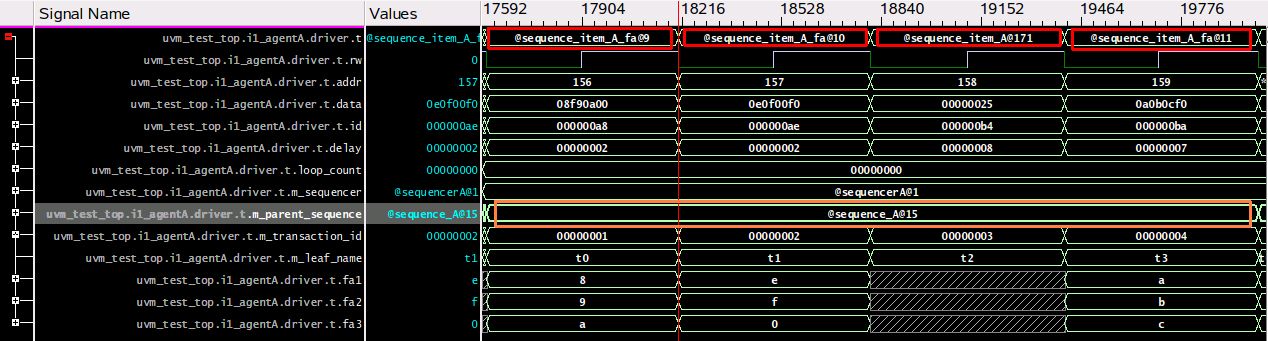
We used the waveform and the class inheritance diagram to figure out which class we needed to look at. Really easy. Just put the driver in the waveform and expand the transaction ‘t’ to see the derived type and the parent sequence.

<The transaction ‘t’ contains a class of type “sequence_item_A_fa”>
![]()
<The parent sequence is of type “sequence_A”>
Tic – Toc
In about 60 minutes we were at the point of the bug. Bob had spent about 2 weeks getting to this point using his logfiles. Winner!
In our 60 minutes, we saw that a derived class was coming into the driver. We traced the inheritance of that class to find a base class which implemented the SystemVerilog queue processing. That code was the place where the error was. After inspecting the loop control we found and fixed the error.
Coffee break time.
Still having fun.
Testbenches are complex pieces of software. Logfiles are very important debug tools, but with debug tools like Visualizer, post simulation testbench debug can be more than just examining predetermined print statements. You can actually explore the UVM data structure and class based testbench. And you won’t need weeks to do it.
Come to the Verification Academy Booth at DAC in San Francisco June 8, 9 and 10 to hear more about UVM Debug and talk in person about your UVM Debug problems. See you then!

