Modal Correlation in Simcenter Testlab 2306
As test engineers, if we work in structural dynamics and NVH, we are often tasked to extract modal parameters on an existing product or a new prototype to characterize its dynamic behavior. These results are then very often used to validate and improve numerical model predictions. The objective is to enhance the accuracy and effectiveness of the digital twin’s predictions, analysis, and decision-making capabilities. In other situations, we want to use modal analysis to observe how the structural behavior changes between laboratory or operational conditions, or even between different operational conditions.
What’s modal correlation, and why is it needed?
Modal correlation refers to the process of comparing the dynamic characteristics (the modes) of a physical structure with those from numerical simulations, typically Finite Elements Analysis, or from the same structure but in different operating conditions. Metrics such as the Modal Assurance Criterion are used to evaluate the similarity between mode shapes. Once pairs of highly correlating modes are identified, the error in their natural frequency is computed. The shape correlation and frequency error, depending on the type of analysis, are used to:
- Verify the impact of different environmental and loading conditions on the results
- Upgrade and update numerical models to reduce the difference between the physical object and the model predictions.
Up to now, in Simcenter Testlab we could perform modal correlation, but only under the assumption that the two models we were comparing shared the same DOF Ids. This is seldom the case when comparing test and simulation models, but also difficult if the measurements are performed by different teams, which might use different naming conventions.
Moreover, as test engineers, we might benefit from a quick correlation with the Finite Element model predictions to ensure that:
- We measured enough locations and are not missing any critical dynamics. If we realize this too late, we might not have the chance to add some additional measurement points.
- Our setup is correct, and the nodes are properly oriented. Much easier to correct this immediately and publish reference results.
- There are no fundamentally wrong assumptions in the model or the experiments. As such, the model can be easily changed, but if something is wrong with the data, or bad boundary conditions were used, a new measurement will be needed. If we observe some differences we can’t explain, we can quickly check with colleagues in charge of the analysis.
So we not only get confidence in the results we deliver, but we can easily identify errors in the setup and correct them on the fly.
How will it work in practice?
With Simcenter Testlab 2306, test engineers will benefit from an intuitive solution to correlate test and simulation mode shapes in a familiar environment without the need to change the platform. The solution allows comparing any type of shape. Coming either from an experimental campaign or a numerical analysis.
One of the key aspects of a correlation analysis is to make sure the same information is compared. The new solution offers a mapping strategy based on proximity, on top of the traditional one based on DOF Ids. The pairs of closest nodes in the two geometries are automatically identified, regardless of their names. Geometries can be defined with respect to different axis systems; in this case, a transformation matrix can be estimated by using some anchor nodes to have them aligned. Finally, as a user, you don’t have to bother about the local axis system and how the physical sensors are oriented, as we make sure the local directions are aligned.
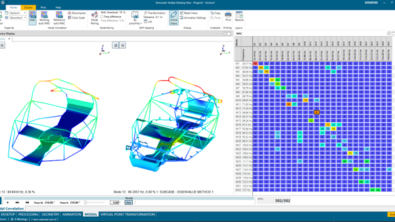
Thanks to new capabilities, it will be much easier to compare modes extracted in laboratory and in-situ conditions. The new capabilities will also allow studying how the dynamic response changes for different loading conditions and operational scenarios. In the example below, we compare the modes of the powertrain of our SimRod extracted from coast-down measurement in ECO or Sport mode.
Another application is shown below, where experimental modes are correlated with Finite Element predictions right after the measurement. While in general, the correlation is good, it was particularly bad for one specific mode. The animation identified this as a tail mode, which was moving vertically instead of horizontally. A check on the geometry showed that there was a mistake in the orientation that could easily be corrected, improving not only the correlation for this mode but for the whole model.
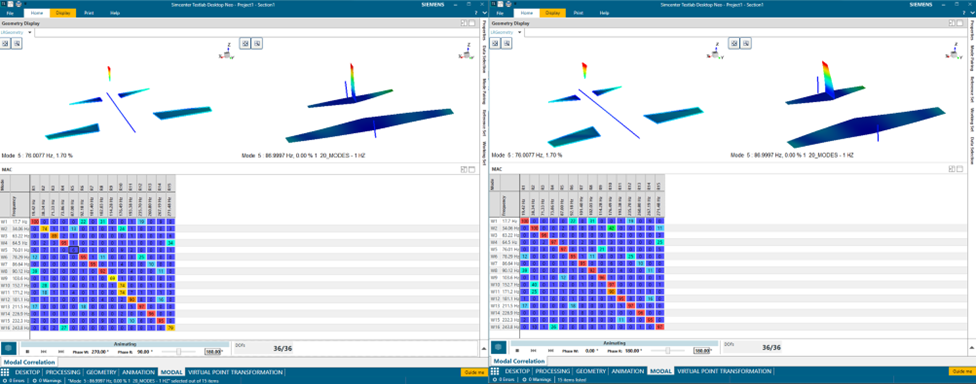
A quick correlation analysis at the end of the measurement can help identify and correct setup mistakes
Comparing mode shapes has never been easier in Simcenter Testlab, and thanks to the new geometric mapping and alignment functionalities, we can efficiently compare test and simulation results. Whether you want to compare different operating conditions or want to validate numerical models, while remaining in a familiar environment, this is the solution you were waiting for.


