Improving NVH prediction by combining test and simulation: a modal analysis short story

The automotive market is evolving and lots of innovations are coming onto the scene, but of course, the electrification of the powertrain is the main trend in this market. The way electric powertrains affect the NVH performance of a vehicle is significantly different from those of an ICE. Consequently, the availability of reliable numerical models to predict and understand these phenomena, and improve design, are crucial to successfully and timely release products to the market. However, these predictions are only reliable if the models accurately represent reality. Let’s see why modal analysis is a crucial tool in validating structural components and how this helps in improving NVH predictions.
In the next paragraphs, I will give you a practical example of that applied to our favorite test vehicle in Siemens, the SimRod.
Virtual NVH troubleshooting
When the SimRod was first extensively tested a few years ago (SimRod experience: Why is this tonal noise so annoying in ECO mode? – Simcenter (siemens.com)) a very strong (and annoying) tonal component was identified when driving in ECO mode. Thanks to Sound Quality and Sound Source localization, it was confirmed that the annoying noise originated from the electrical powertrain (engine and gearbox). To really understand the source of the noise, a more in-depth study was clearly needed, and the quest to build a full multiphysics digital twin of the complete powertrain started. A first model was built, but it failed to accurately predict the operating conditions. To improve the model, a more fundamental approach was taken, to focus on validating each individual phenomenon first before combining them all together (gear contact modeling, electromagnetic forces analysis, and the housing mechanical modeling). Numerical and experimental modal analysis was the natural choice for the validation of the powertrain housing model.
Why modal analysis?
Modal Analysis has been extensively used in the past 30 years to explain the structural dynamic behavior of components and structures. Modal parameters – natural frequency and modal damping – can be extracted by solving the structural model and measuring the physical item. Experiments are typically performed by suspending the structure to replicate free-free boundary conditions, which already removes a lot of modeling uncertainties.
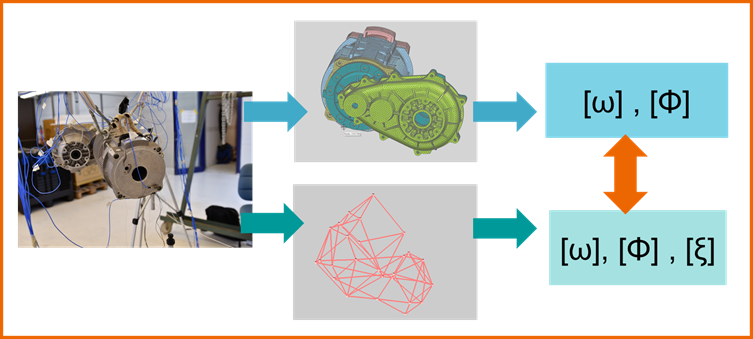
The results – natural frequency and mode shapes – are system characteristics and can be derived from both test and simulation. As these modal parameters primarily relate to the mass and stiffness distribution in the structure or at the connections, they are used to validate and update numerical models.
Defining the optimal test setup
Once a CAE model is available, it can be used to perform a pre-test analysis. In this phase, the information available is used to optimize the test setup and identify the number of transducers and the optimal measurement locations to:
- Extract all modes in the frequency range of interest.
- Ensure these modes are unique (too few sensors will cause all modes to look similar).
- Have a good representation of the test object to validate test results.
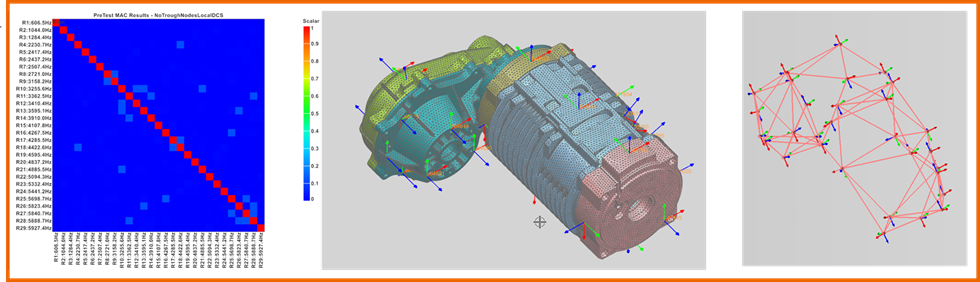
These results are achieved using dedicated software solutions, but also by ensuring proper communication between the engineers in charge of the modeling and the experimental activity. In this case, a first set of 15 measurement locations was chosen by the test engineering to ensure the overall shape of the powertrain was visible in the wireframe. Starting from this first set, an automatic procedure was used to select the location of 15 additional sensors to guarantee all modes up to 6 kHz could be uniquely described.
Running the experiments and analyzing the results
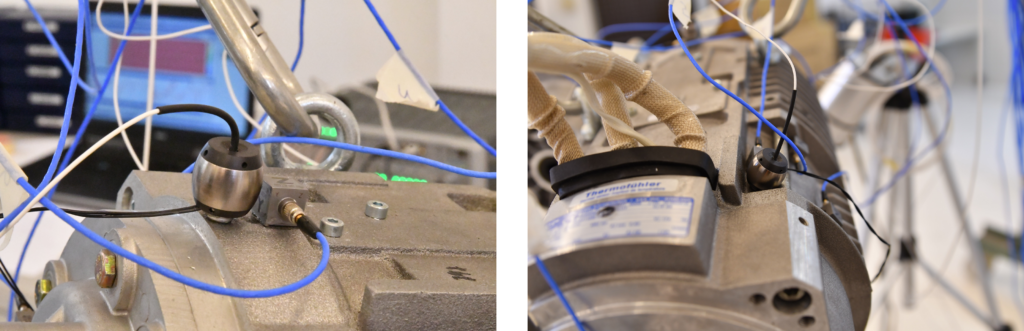
Having the geometry including the locations and orientations of the sensors, we simply need to instrument the structure and run the test. In this case, considering the size of the structure, we opted for a Multiple Input test and excited with 2 Simcenter Qsources High-Frequency Shaker.
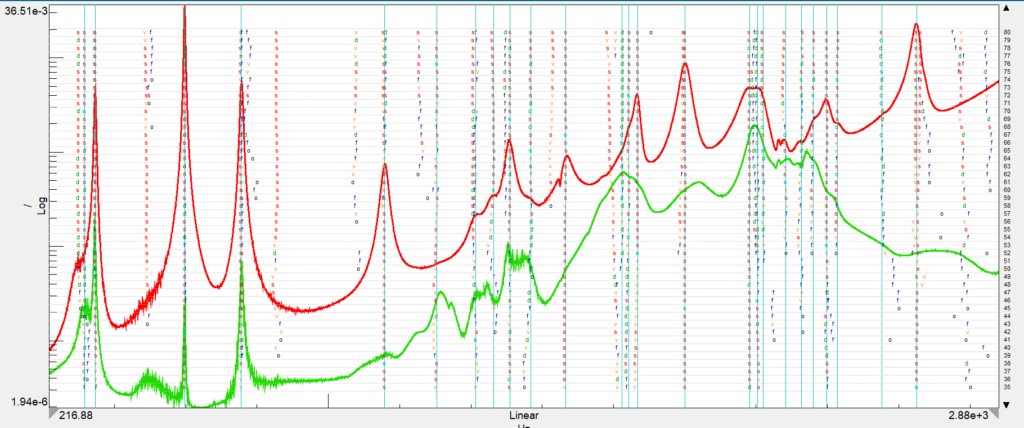
After validating the data and ensuring the structure was well excited up to 6 kHz, modal analysis can be applied. We relied on Polymax and its clustering-based automatic modal parameter selection algorithm to select the modes in the stabilization diagram. Real residues and reciprocity were imposed on the mode shape calculation to ensure a more accurate comparison with finite element results.
How is the model predicting the experimental results?
With the experimental results available, we can now validate our initial simulation model predictions. This is easily done since the measurement locations were chosen on nodes of the FE model directly and there is no need to align them. Moreover, Simcenter 3D can read directly the geometry and modes inside the Simcenter Testlab project, without the need of exporting the results upfront.
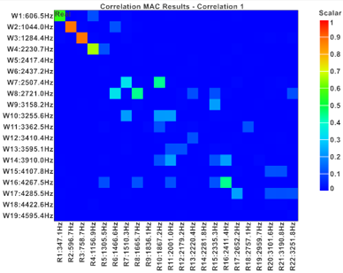
After computing the Modal Assurance Criterion between the experimental and numerical modes, it became immediately clear that something was wrong. Besides the poor correlation between modes, the model seems to be overly rigid, with the first mode at 600 Hz against the 350 Hz measured experimentally. After discussing with the simulation colleagues, it turned out they used a rigid surface-to-surface connection to connect the different parts of the assembly, resulting in an overly stiff model.
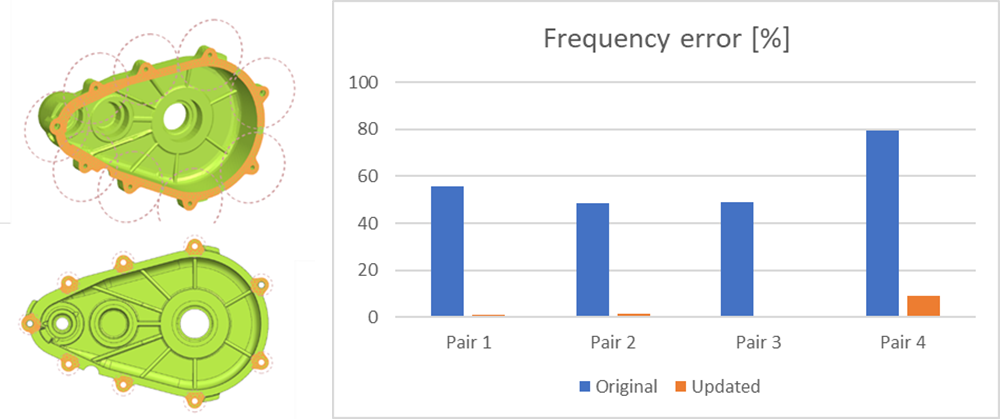
The model was then rebuilt, changing the connections. And since the experimental data were available, an automated procedure was set up in Simcenter Heeds to change the contact surface around each bolt to optimally match the experimental data.
As a result, the difference in the frequency between the test and simulation results, for the first few modes, dropped from more than 50% to significantly less than 10%.
Improving the accuracy of your simulation thanks to experimental modal analysis
Sometimes, a quick experimental test can avoid a lot of headaches. In this case, the experimental modal analysis provided simple and reliable results to prove that the finite element model needed to be rebuilt, reconsidering some of the initial assumptions. The test results provided then clear guidelines on the targets that needed to be achieved to obtain better model accuracy.
Simcenter offers highly integrated solutions to support the complete process, ensuring all tasks are carried out in the most efficient way, from test definition to data collection, data analysis, model correlation, and model updating.
What’s the outcome? The initial housing model, being too stiff, was providing erroneous results when combined with the other elements to predict the operational NVH behavior. Combining the updated housing model with other improvements in the magnetic force simulation and gear contact modeling, allowed for a better replica of the measured data. This more accurate model allowed us to identify in the gear micro geometry the source of the annoying tonality, but more on this to come soon.


