Simcenter Testlab 2206: ODS, animation and geometry
A few weeks ago, I was at home watching and enjoying the Belgian Formula1 Grand Prix. For sure, it would have been an amazing experience to be there live, but thanks to television and streaming apps, we can nowadays enjoy the complete race without missing anything. Would it have been the same 60 years ago, before every family had a television screen? Probably not. The information was shared, by radio or the day after in the newspaper, but it would not be the same. You would hear what happened, check the ranking, and read about choices and strategies, but something would be missing.
Similarly, when performing a measurement, we can go through the data to spot the problem, trying to localize it and understand what is happening and what is causing it. But whenever possible, I always try to create a geometric representation of my test setup, on which the results can be visualized and animated. If I spot a critical operating condition, I can quickly understand what is the most affected component, how it behaves compared to the rest of the structure, and which actions I should take to fix the problem. Also, good geometry can help in making sure the instrumentation has been done correctly and there are no tilted sensors, direction errors, etc.
Creating a proper geometry is sometimes seen as a time-consuming and perhaps unnecessary effort in test campaigns when we are already under huge timing restrictions. But think about the time you would save if, by visualizing the response at low frequency, you realize there was a direction or sensitivity error in your channel setup. You could fix the problem on the fly and save a lot of time afterward to correct your data.
To help users in this process, with the newest release of Simcenter Testlab Neo, we introduced several tools to help create test geometries faster and more efficiently. Measured data can then be interactively animated on the geometry and the operational response visualized to ensure we don’t miss anything from our data.
Automatically create shapes and wireframe models
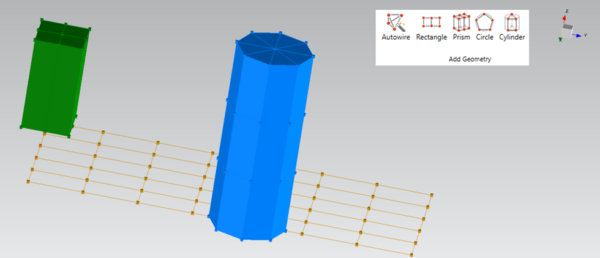
First, on top of the core geometry creation capabilities, we introduced in the previous release, it is now possible to easily create discretized geometries of basic shapes such as circles, rectangles, prisms, and cylinders. You can choose how these shapes are discretized and whether you want to automatically create lines and surfaces or not between the nodes.
When dealing with large numbers of nodes in the test geometry, manually connecting all of them to create a nice wireframe can be a long and tedious task. Let’s take the example of a bell we tested a few weeks ago. We had 168 nodes, corresponding to our impact locations. It took a very long time to get the data, but we could draw a very nice geometry by adding lines in between with just a few clicks and dramatically improve the quality of the animation of the mode shapes.
Automatic geometry and modal model reduction
We also decided to help those customers who want to use finite element models in support of their test analysis. Let’s keep in mind that in many situations, the main purpose for a structural dynamics or NVH measurement campaign is the validation of the model. If the model is available, it can be used to prepare the test setup, get a better understanding of what we can expect during the test, and later be used to compare the test results or enhance the animation. However, these models are often too big and contain way more information than we need.
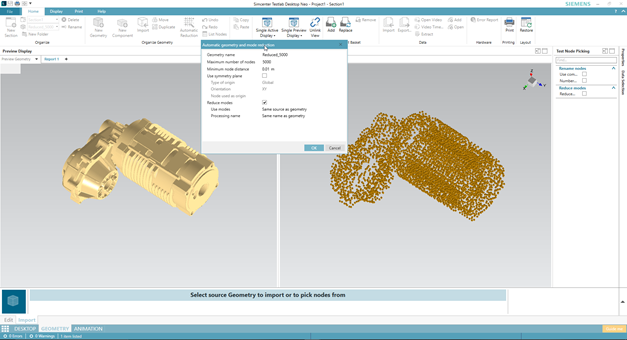
To solve this issue, we decided to develop new functionality to automatically reduce a large model before importing it into Simcenter Testlab by simply defining the maximum number of nodes and the minimum distance between them. Models with millions of nodes can be efficiently reduced by more than an order of magnitude without practically losing any interesting information. And on top of keeping the nodes, you can also reduce a mode set if it is part of the original geometry. Thanks to this, modal expansion, comparison of shapes, or the recently introduced node picking can be done much more efficiently.
Gain more insight into your structure by animating operational data
An operational deflection shape, as the name suggests, is a visualization of the structural and acoustic response of a structure at a specific operating condition. They are typically extracted from measured functions (FRF, Spectra, orders, etc.) on which we select a specific operating point that we want to visualize in the geometry. The main advantage compared to traditional analysis is that thanks to the link with geometry, we can visualize the response of all our points at once.
With this new release, you will not only be limited to performing the analysis on functions anymore, but operational deflection shapes can now be extracted directly from colormaps. Why is this important, some of you might ask? Well, on a colormap, you get the complete overview of the operational response of the structure you are testing, and you can use it to identify critical conditions without having to first extract functions and then get through them.
Another major improvement is the fact that now the data for the analysis is managed using the powerful pivot table and data can be easily arranged and filtered on the fly.
Finally, once an operating point is added to the analysis, a list is populated and the corresponding operating points are annotated. You will immediately see which points have already been stored, and you can easily review all stored animations.
Embrace a new way of analyzing your data
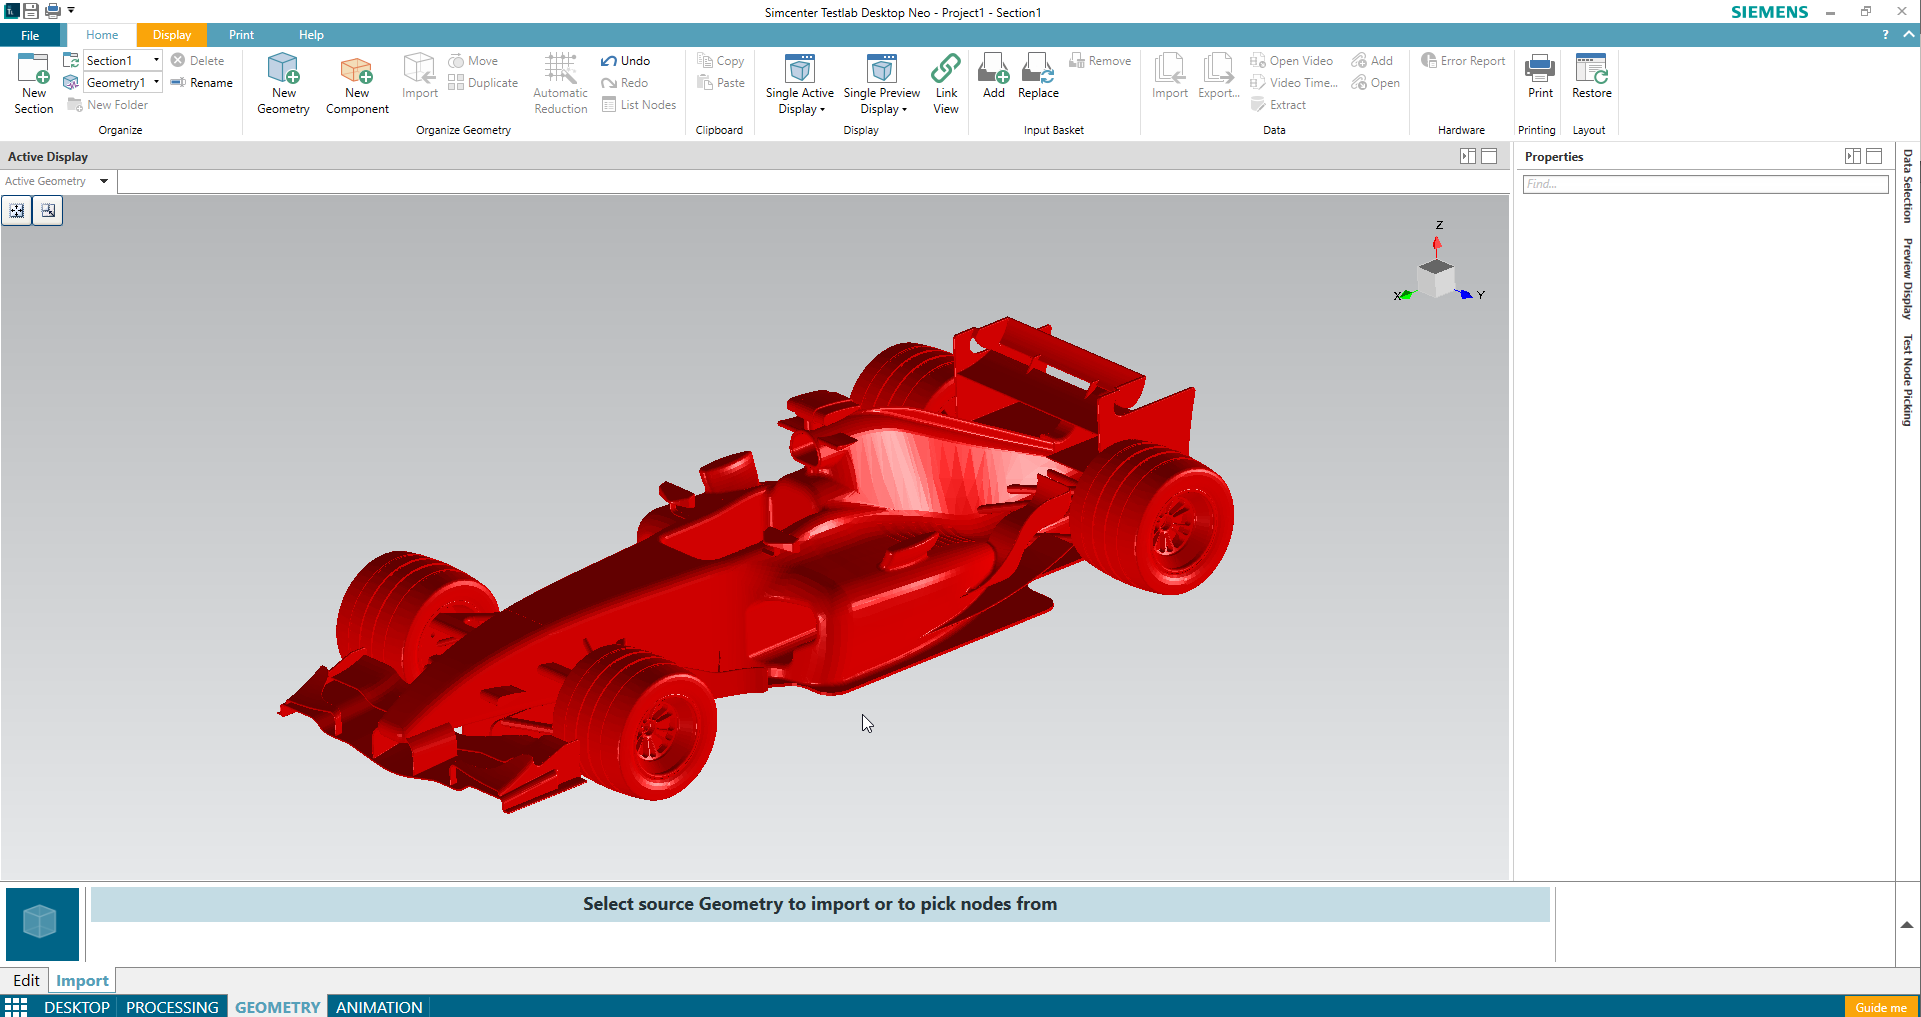
Thanks to the new capabilities we added in Simcenter Testlab Neo, it is now possible to very easily and quickly create test geometries, starting from existing models or from scratch. Once data are available, the new Operational Data Animation tool combines with geometries to provide powerful visualization of structural behavior at critical operating points.
As for my side, while getting ready to book my ticket for the F1 Grand Prix of next year, I’ve already prepared a project in case I’ll get the chance to run some NVH measurements on a Formula 1 car (and you can guess from the color and the fact I’m Italian what that might be).
Want to know more?
Now that you know what the highlights are, we can recommend some dedicated articles on our community that will provide a good overview of all the new capabilities:
Simcenter Testlab Neo: Geometry Creation
Simcenter Testlab Neo: Operational Data Animation
Simcenter Testlab Neo: Operational Data Animation during Runup / Rundown


