End-to-end durability for Automotive

A recent test campaign has confirmed the effectiveness of an end-to-end approach to durability testing using a specially developed toolchain for data acquisition and analysis
The Siemens Industry Software Simcenter engineers put the end-to-end durability solution to the test on the rough tracks of a German proving ground. The outcome is a step-by-step account of a test campaign that demonstrates the effectiveness of the solution.
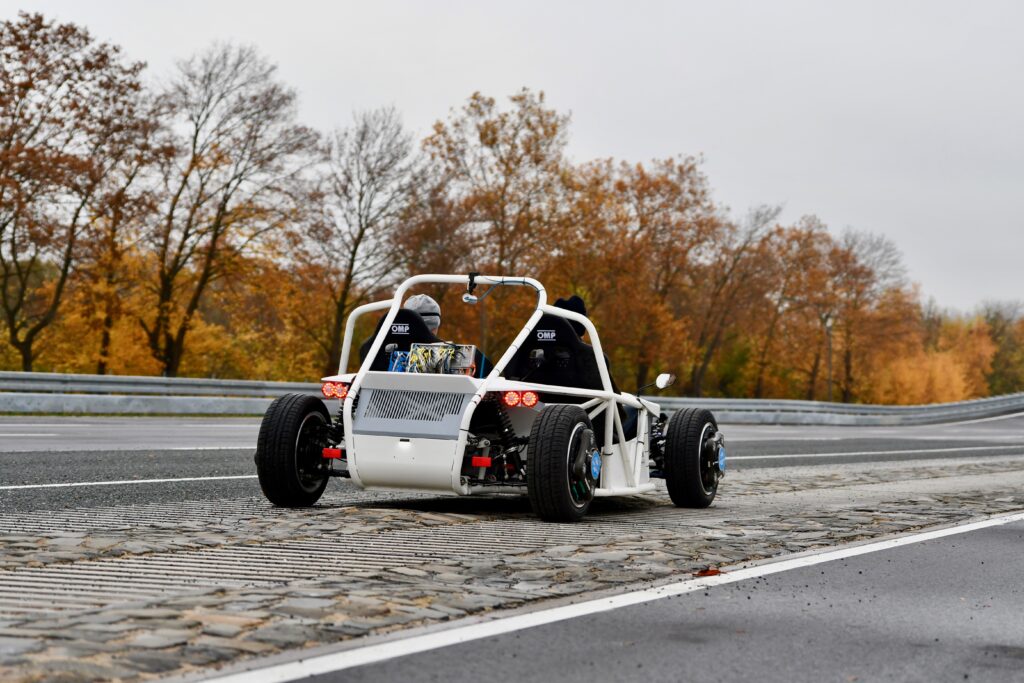
The story starts with a small but punchy electric sports vehicle that grew into a test vehicle for a condensed but complete durability measurement campaign.
Step 1: Instrument the vehicle
This test campaign, like any other, begins with instrumenting the test vehicle, the SimRod, with a wide range of sensors: strain gauges, accelerometers, string and laser displacement sensors, force cells, pressure transducers, and thermocouples. All inputs are safely connected to the Simcenter SCADAS data acquisition system.
Step 2: Run instrumentation tests
The next step is to prevent instrumentation errors such as wrong sensor direction, incorrect scale of the measured value, or missing output. The Simcenter Testlab Control App is the perfect piece of software to perform these checks.
The app runs on any Android mobile device and gives a clear and crisp overview of the measured data in the form of simple numerical values, time series, or online calculated statistics values. The user obtains enough information to decide instantly whether the measured run is valid or not.
To validate the instrumentation, the test engineers drive around on an empty parking lot within the Siemens premises, drawing “8” shapes on the ground, as well as accelerating from standing position to full speed and braking suddenly. They confirm the robustness of the set-up, the accuracy of the sensors, and the good correlation between them.
Step 3: Create the test schedule
The test schedule gives an overview of test runs required to cover a variety of customer usage scenarios, according to the targeted durability objectives. It is often defined by a customer-correlation project that helps predict the vehicle’s usage and driving conditions. This project requires an extensive fleet of vehicles driving on public roads over a long time and acquiring data to generate a realistic customer usage profile.
This profile is used to replicate the total damage resulting from the vehicle’s usage on the proving ground tracks. The Simcenter Testlab Neo software embeds a smart algorithm that helps define the test schedule and the number of necessary proving ground runs. For the small SimRod project, a simple test schedule based on experience and common sense replaces the extensive customer-correlated profile creation.
Step 4: Drive the miles
To reproduce the high load inputs on the vehicle, the engineers drive on the Belgian block and sawtooth profiles tracks of the proving ground, at speeds of respectively 30 km/h and 50 km/h.
Not only does the Simcenter Testlab Control App alert the team of any anomaly during the run, but it also records the car speed and compares it to the set limits, instantly instructing the driver to accelerate or decelerate.
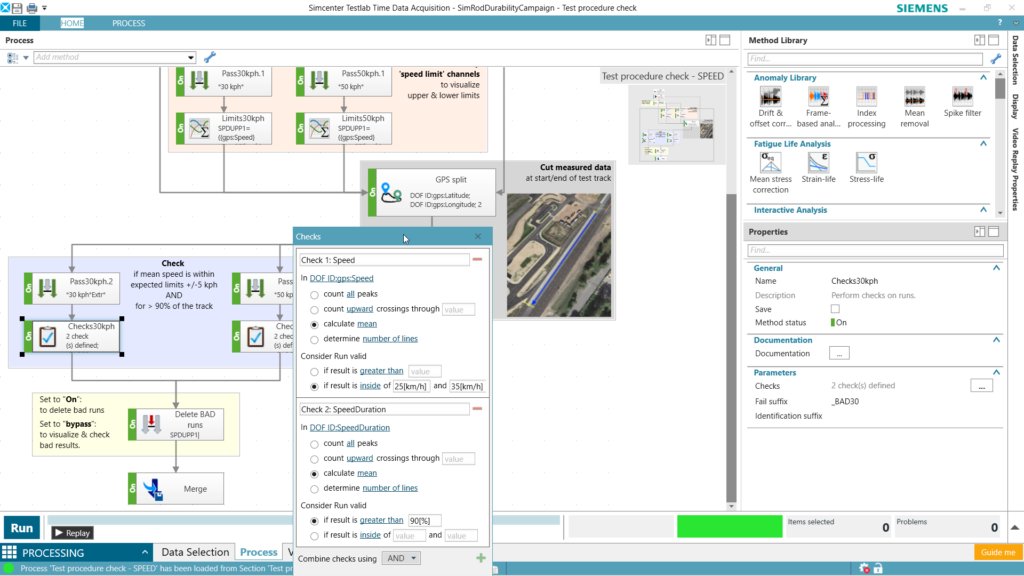
The durability track is a one-way side road of the outer oval circuit. While driving along the oval circuit to reach the entrance of the one-way road, the driver kept on acquiring data. With the GPS splitter method, a new feature in Simcenter Testlab Neo, it is easy to remove the data acquired on the oval circuit. Using Google Earth or any similar geo-location software, the engineer defines in a few clicks the start and end of the durability track to cut out the unnecessary data.
Step 5: Validate the data and procedure
The Simcenter Testlab Control App helps assess the data and run quality at a glance. Abnormal peaks or drifts in the data are clearly visible and alert the engineer about anomalies. The app automatically calculates different statistics for each sensor and marks excesses in orange or red. Another tab displays potential hardware errors. In case of sensory overload or cable disruption, an error message clearly indicates the defective channel.
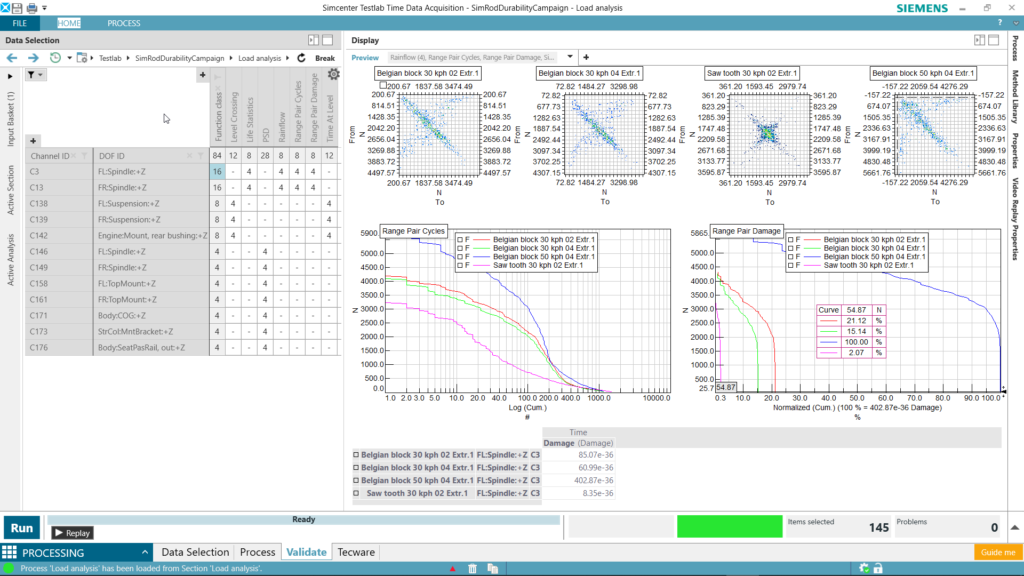
At any time after, or even during, the measurement, the Simcenter Testlab Neo software easily generates a clear comparative overview of the many measured channels. Simply selecting the desired data, either measured or processed, in the ‘Pivot table’ will automatically show in a ‘Preview’ display the correct, corresponding graph. By grouping channels according to specific attributes such as measured quantity or applied filters, users can get an overview of 100+ channels in a single window.
Engineers also want to ascertain that the tests were conducted within the pre-defined conditions. These conditions are customer and test-dependent. For the SimRod campaign, one of the conditions was to perform runs on the Belgian blocks track at a constant speed of 30 and 50 km/h.
The run checker is a new software functionality that drastically simplifies data validation. The test engineer can define the test conditions in a few clicks. If the run conditions are not met, for example, if the driver drove too fast or too slowly, the software marks the respective run as bad. Consequently, the test engineer can immediately focus on the valid runs without having to manually check them.
Step 6: Consolidate and analyze
Processing data in Simcenter Testlab is an intuitive operation: engineers simply drag and connect methods to generate a process. Once defined, the process can be memorized for future measurements, allowing easy process automation.
Simcenter Testlab presents a task-based software environment that suits for both novice users and experts. Novice users rely on the industry-validated pre-defined durability processes and can modify and save new parameters and process flows when required. Experts access the full breadth of functions to customize and automate their processes.
Simcenter Testlab not only includes in one single software platform common analysis features such as anomaly clean-up, filtering, new channel derivation based on mathematical operations, but also load-counting analysis (rainflow, range pair, time at level, level crossing), damage and fatigue lifetime calculation and frequency-based analysis. Processing times are extremely quick.
Step 7: Report
Effective reporting is key. The Simcenter Testab software allows creating and sharing active reports in a mouse click. The measured data is fully embedded into the report charts, yielding interactive graphs in place of static bitmaps. Other team members or management can further dive into the results and format or edit graphs as they see fit.
The aim of the SimRod campaign was not to confirm the durability performance of the sports car but to validate its digital twin model. Nevertheless, the Simcenter engineers benefitted from the hardware and software’s embedded productivity enablers and track-side validation methods. The campaign confirmed the effectiveness of an end-to-end approach to durability testing.
Learn more about durability here.