Perform load analysis with real-world results
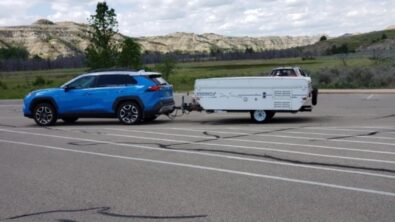
There are more forces at work than just pulling when hauling a trailer. The load on the towing vehicle is very dynamic and can be difficult to classify. However, this article explains an easy, robust approach to determining loads on anything – including a trailer hitch. Wolf Star Technologies’ True-Load software will be used to understand the loading on a trailer hitch.
The process starts with a Finite Element Analysis (FEA) model of the structure, in this case, a trailer hitch. The hitch was modeled in Siemens NX software and meshed in Simcenter. This particular application used an Assembly Finite Element Method (FEM). A unit load is simply a force, or moment, imposed on the structure with a unit magnitude. The magnitude value is simple (say 100 pounds, for example) and consistent for all unit loads.
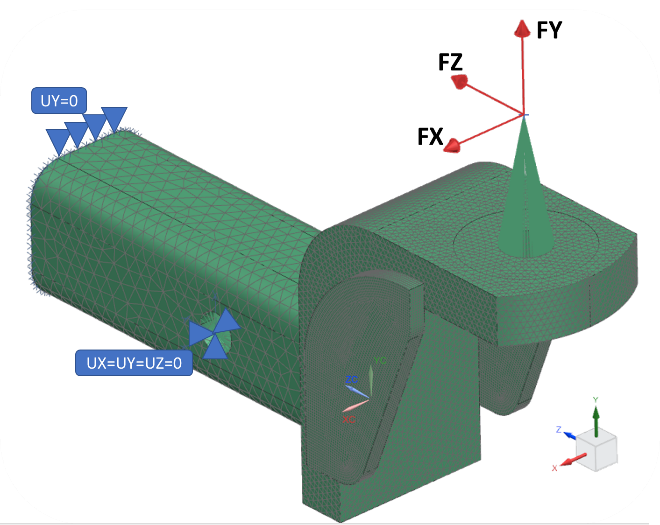
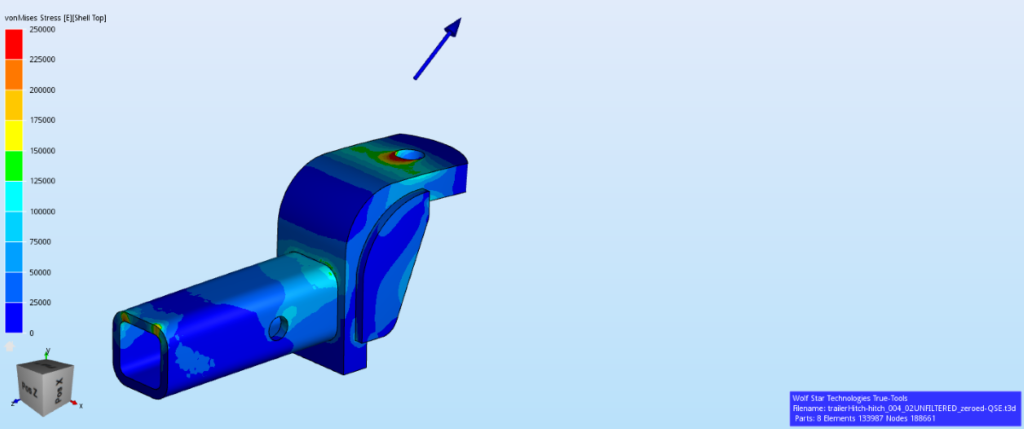
For this Assembly FEM, three-unit loads were applied to the center of the hitch ball (100 LBF FX, FY, FZ). As represented in Figure 1, the hitch was restrained at the pin center (UX=UY=UZ=0), and the top edge of the hitch tube was restrained in the UY=0 (vertical direction), representing the hitch interface to the vehicle.
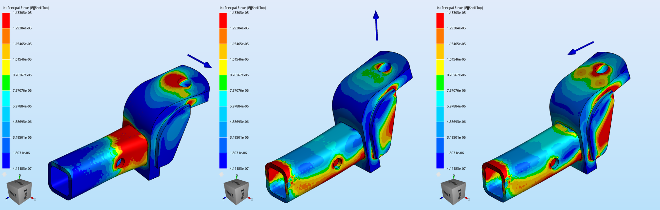
The Simcenter 3D NX Nastran solver created three sets of results for these three-unit loads. First, the results from the FEA solution created a full-field strain response on the structure. True-Load utilizes these strain responses on the structure to place strain gauges and develop a relationship between strain response and the unit load cases.
Ideal strain gauge placement
The NX Nastran OP2 file was imported directly into the True-Load software. The True-Load software user selected candidate strain gauge locations. Typical candidate locations include nominal locations of the assembly but do not include part-to-part interfaces, stress concentrations such as holes, or areas where laying strain gauges is not physically possible.
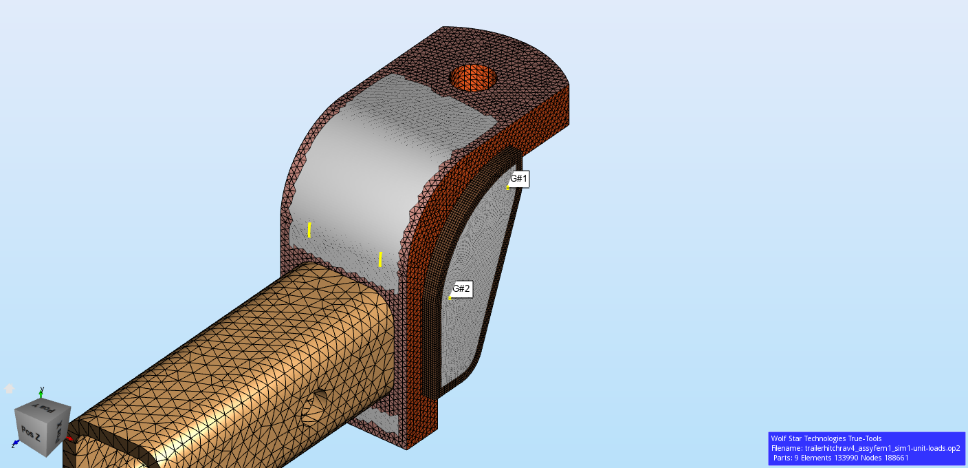
Since the entire hitch tube is recessed into the mating feature on the vehicle, no area of the hitch tube could be considered a strain gauge candidate location. The remaining areas available for gauges were the hitch bracket and the side plates. However, the trailer ball takes up too much area on the top and bottom of the hitch bracket for gauges. The side plates are welded to the hitch bracket, and placing strain gauges at the stress concentrations of welds should be avoided. The True-Load technique requires the candidate strain gauges in nominal areas on the structure to assure a robust relationship between applied load and strain response. The portions in Figure 3 colored in silver indicate the candidate elements used for the True-Load analysis.
Once candidate elements were selected, True-Load automatically identified the optimal locations for the strain gauges to perform load reconstruction. Then the user inputs the number of strain gauges into the software. Mathematically, the procedure would work with three gauges for three-unit loads. However, the general rule is to use twice as many gauges as unit load cases. Therefore, this example uses six gauges for the three-unit load cases.
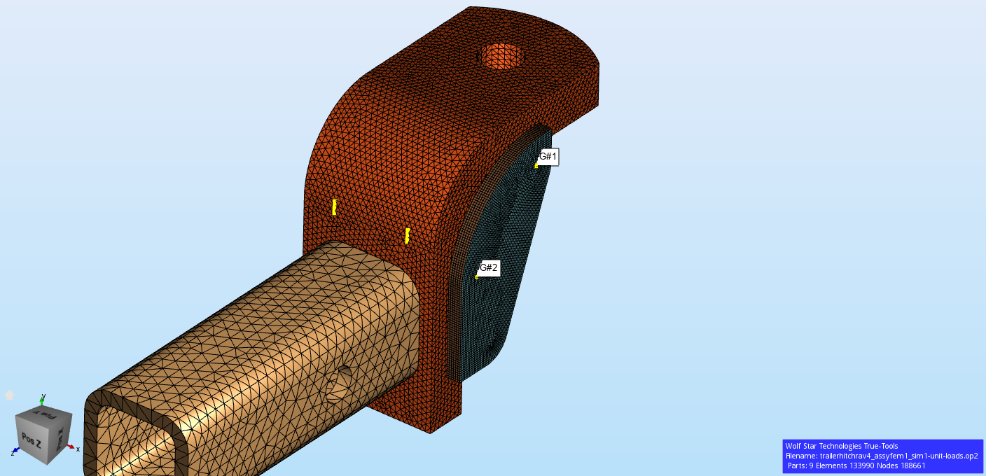
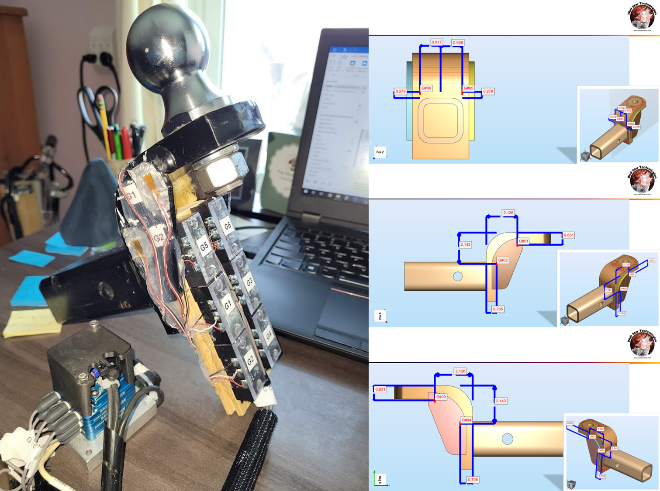
Figure 4 illustrates where the strain gauges were placed. Two gauges were placed on each side panel, and two more were placed at the rear of the hitch bracket. All gauges used were uniaxial strain gauges and coincidently oriented parallel to the vertical (Y) axis. Once the gauges were modeled with True-Load, engineering prints for each of the gauges were created. Then the physical gauges were installed.
Dynamic forces decoded with True-Load software
A DTS Slice Micro data acquisition (DAQ) system was set up for 6¼ bridge strain gauge channels, as seen in Figure 5, with a sampling rate of 1 kHz. The sampling duration was operator-controlled to capture multiple driving events. Events included approaching/leaving a stopped position, backup maneuvers, city driving, highway driving, hills, bridges, and on/off ramps.
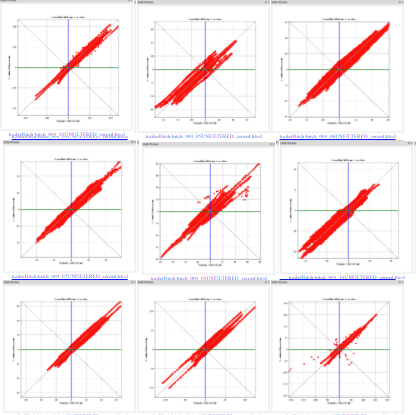
Once the data for all events was collected, the True-Load/Post-Test software processed the strain data using the correlation matrix extracted from the FEA modeling during the True-Load/Pre-Test gauge placement exercise. This resulted in a calculation of the operating loads on the hitch. Once these loads were known, the True-Load/Post-Test software automatically calculated the simulated strain response at all the gauges and created cross plots of measured strain (horizontal axis) and simulated strain (vertical axis). Figure 6 shows the strain correlation plots for nine events. These plots show all gauges for all time. There was some error in the plots due to poor gauge placement, which can be common and deserves consideration.
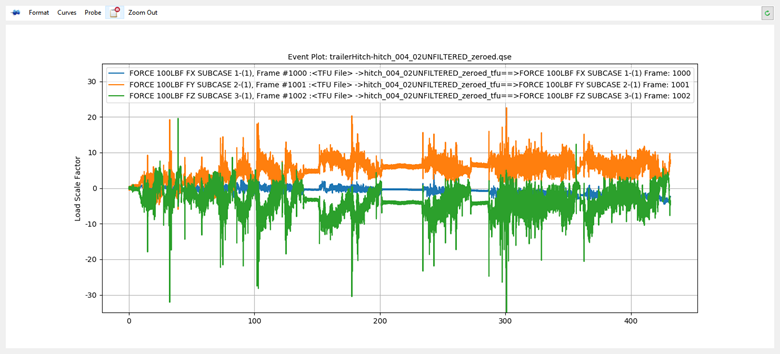
The loads were then stored in data files and, together with Wolf Star’s True-QSE software, the loads were fully plotted and interrogated, as well as the rest of the structure. As shown in Figure 7, the force on the hitch (orange) during an extended period acted upward, whereas the hitch’s fore/aft load (green) was mainly pulling rearward except when braking and stopping.
With a loading time history calculated, responses anywhere on the hitch can be calculated. These loads can even produce operating deflection shapes (ODS).
This project shows how True-Load software can be used to understand all of your product loadings. True-Load can turn any part into a load transducer from just a few strain gauges and an FEA model. True-Load produces strain correlation plots to give you confidence in the calculated loads. Once you have strain-correlated loading, you have the power to design without additional trips to the proving grounds.
About the author
Tim Hunter, president and founder of Wolf Star Technologies, developed the first-to-market True-Load© suite of load reconstruction tools by leveraging 30 years of engineering experience. Tim’s True-Load software helps customers realize the full potential of their products by understanding real-world product loading.
Partners who build solutions
Wolf Star Technologies is a Siemens Digital Industries Software Software and Technology Partner. Software and Technology Partners utilize Siemens Xcelerator and its flexible open ecosystem by building technologies that complement the comprehensive digital twin and provide solutions tailored to meet the demands of mutual customers. In addition, Wolf Star Technologies develops, sells, supports, and markets hardware and software solutions that are interoperable with Siemens products and ensure infrastructure compatibility.


