Uncorked: The force needed to pull a cork
If you’re an engineer like me, you cannot truly relax with a bottle of wine until you know the load on the corkscrew needed to open the bottle. Fortunately, my True-Load load reconstruction software provides the answer, so I can enjoy my wine.
Understanding real-world loading is imperative for proper simulations when modeling even simple mechanisms. Traditional approaches that use company standards or MBD simulations provide, at best, approximations of actual load conditions. So, the results are only as accurate as the approximations.
Experimental load reconstruction is a non-invasive solution to this problem. To understand the complex loading on a corkscrew, we will use True-Load® Load Reconstruction software and an unmodified corkscrew with uniaxial strain gauges to demonstrate.
This approach will involve the creation of an FEA model of the corkscrew. The corkscrew will have unit loads applied to the corkscrew, allowing us to construct a correlation matrix relating strain response to applied loading (Figure 1). The operation of the corkscrew will be used for pulling wine bottle corks. As will be seen, the loads will vary greatly from bottle to bottle.
The approach provides real-world structural loads that can drive accurate FEA simulations. Every test event is different; thus, the loading profiles are different. Traditional analytical techniques idealize the conditions and loading environment. The real world is complex, and every event is unique. True-Load loads provide real-world loads for real-world simulation.
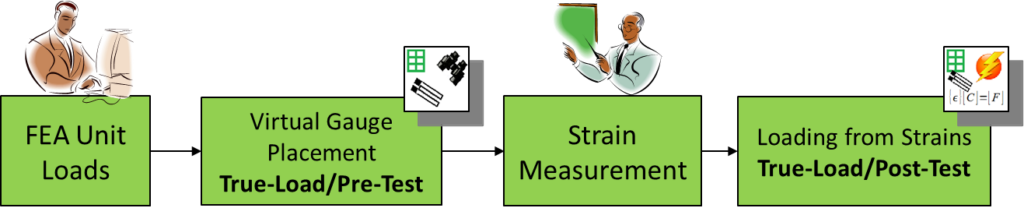
This process can be summarized with the following diagram:
The corkscrew: problem description
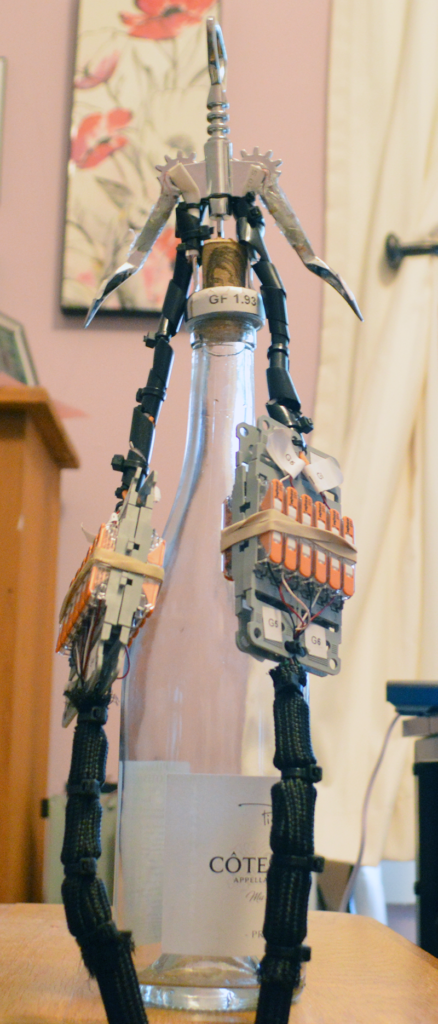
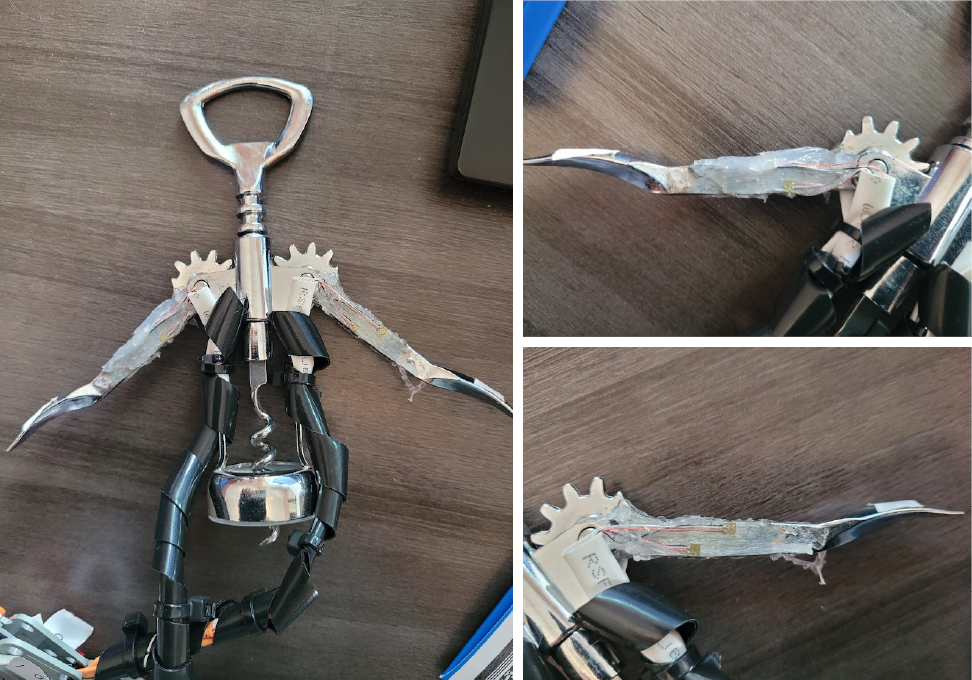
This exercise will recover the loading on a corkscrew (Figure 2). The loading scenario will be a normal procedure for opening a bottle of wine. Note that the test articles are re-corked bottles. The model of the corkscrew was created from 3D scan data provided courtesy of the Milwaukee School of Engineering.
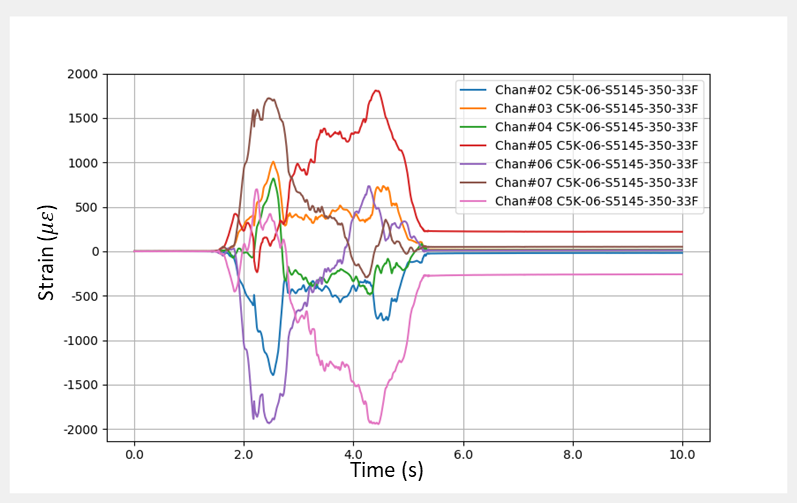
The DAQ system is a DTS Slice Micro DAQ with eight channels of ¼ bridge strain sensing (Figure 3). The unit is powered by a small battery. Data is downloaded via USB cable. We used Micro Measurements C5K-060S5145-350-33F strain gauges. These gauges are 0.76 x 1.76 MM (matrix: 3.1 x 2.6 MM) with pre-soldered lead wires. Three-inch lengths of the lead wires are unshielded. The short lead wires were attached to the shielded cabling of the DAQ system to minimize external electronic noise. The gauges are coated with RTV silicone sealant for protection (Figure 4). The wires for the gauges are routed through the hinge point of the corkscrew arm to minimize wire movement.
Unit loads
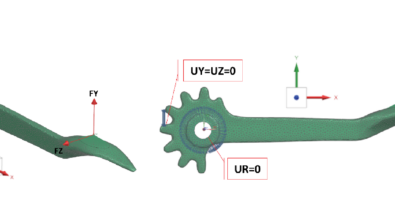
The unit loads for the Corkscrew are created in Siemens Simcenter. The FEA solver was Siemens Nastran. Figure 5 shows the unit loads are applied at center of the face of the arm handle (FY, FZ).
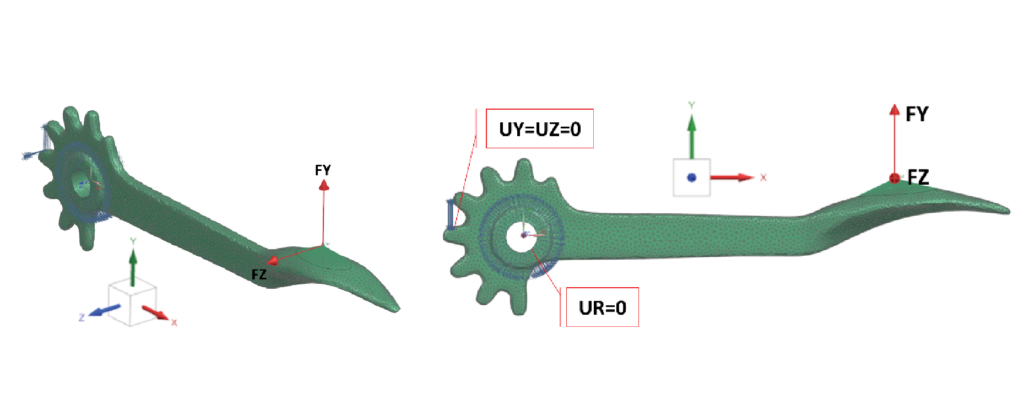
The center of the corkscrew is restrained in a radial direction (UR=0). One gear tooth of the handle was restrained (UY=UZ=0). The gear tooth restraint is an approximation; however, this should have minimal to no influence on the resulting load calculations.
Pre-test
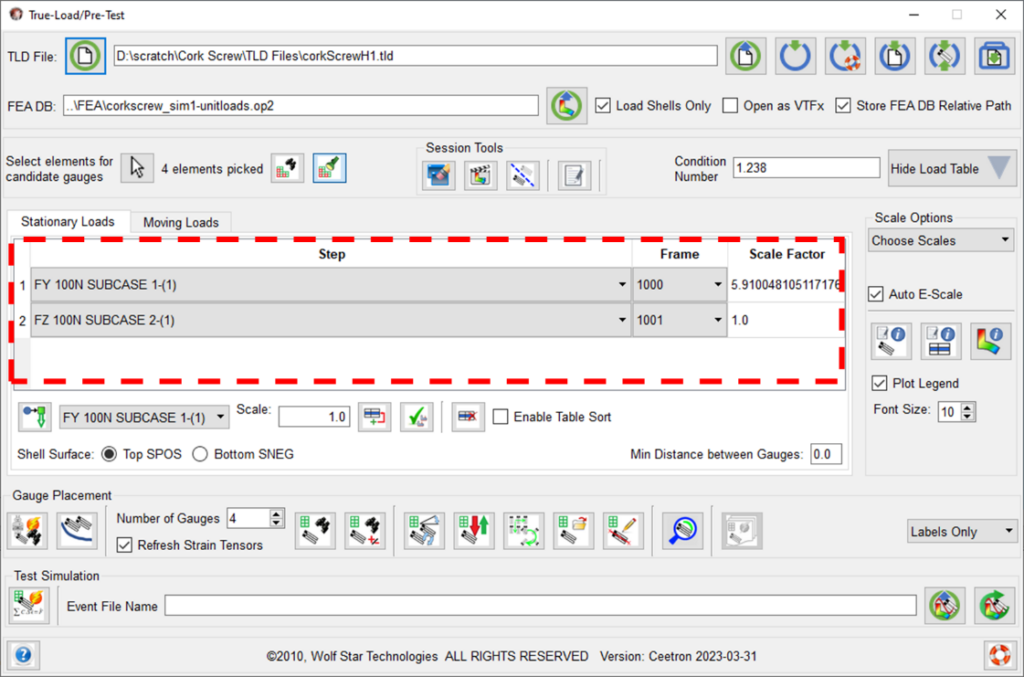
The True-Load/Pre-Test software was used to load in the two-unit load cases and the corresponding strain results from the FEA model. The GUI from the True-Load software is shown below with the table of the unit load cases loaded (Figure 6).
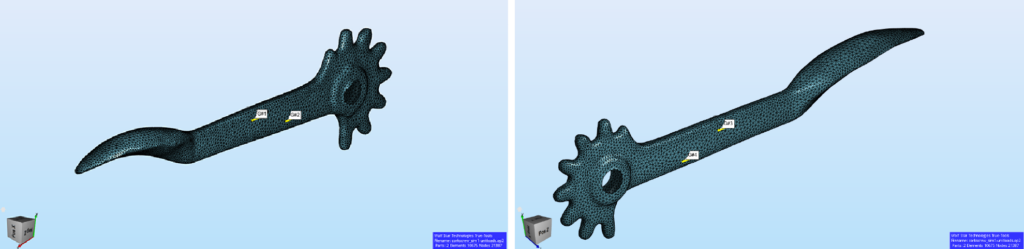
The final strain gauge placement is shown below. The gauges on the fore/aft sides of the arm are mirrored about the central plane (Figure 7). Two True-Load (TLD) files created, one for each arm. Eight strain gauges will be used in testing – four on each arm – to be sensitive to two loads.
An important phenomenon to understand is the stability of the correlation matrix. The True-Load software provides a utility that calculates the ideal strain for each unit load case and then applies a 5% random signal noise to the idealized strain. These strain signals are then multiplied by the correlation matrix to determine the corresponding load response. Ideally, each load is turned on one by one and the other loads are turned off. Figure 8 shows the load sensitivity to strain noise. The Load Assurance Criteria (LAC Matrix) is also illustrated. Ones on the diagonal and near zeros on the off diagonal indicate tolerance to modest amount of signal noise and that the chosen gauges comprise a stable system of equations.
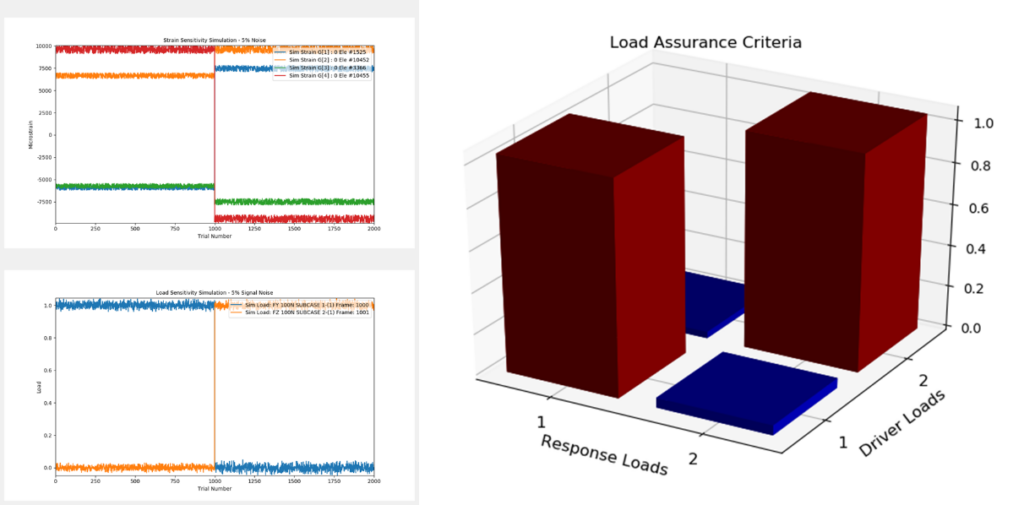
This plot shows that the system of gauges chosen produces a very stable system of load reconstruction which can tolerate noise in the strain signals.
Strain gauge application
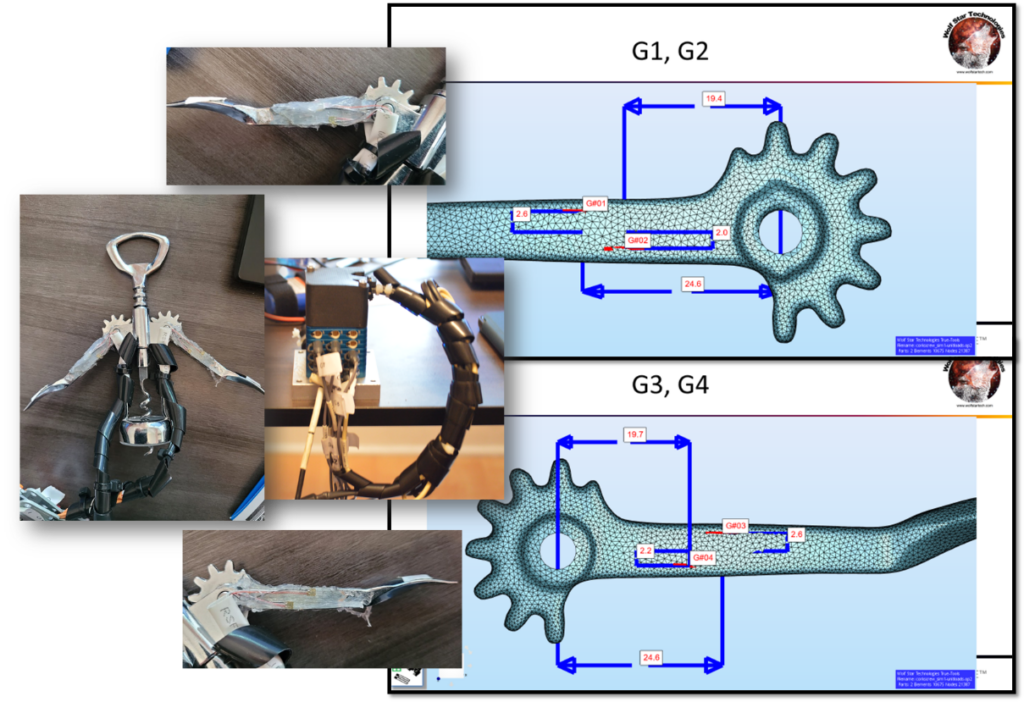
A series of drawings were created, which located the strain gauges on the physical structure (Figure 9). These drawings were used to place the gauges on the physical part using calipers and other measurement techniques.
Calibration
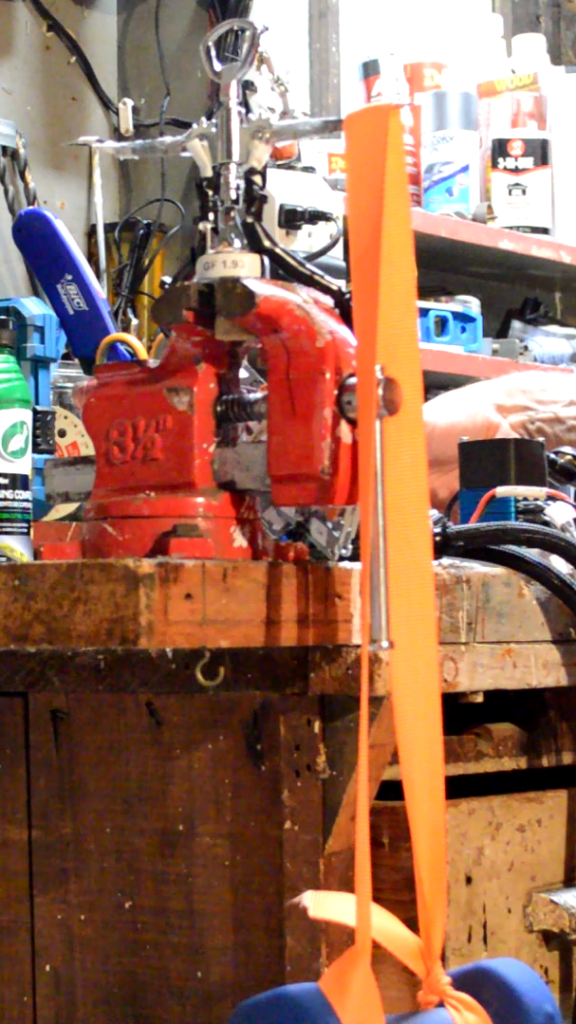
Since the strain gauges on this corkscrew are very small – 3.1 x 2.6 MM (0.122 x 0.102 in) – and the geometry on the arm has no well-defined fixed datums, we conducted a calibration procedure to check and update the virtual strain gauge placement due to positioning errors in test. The calibration procedure involved a 5 Lbf barbell dead weight. The 5 Lbf dead weight has an actual weight of 5.122 Lbf.
The corkscrew device was mounted in a bench vice with the arms of the corkscrew in a horizontal position (Figure 10). The 5.122 Lbf barbell was hung from the horizontal corkscrew using nylon strapping.
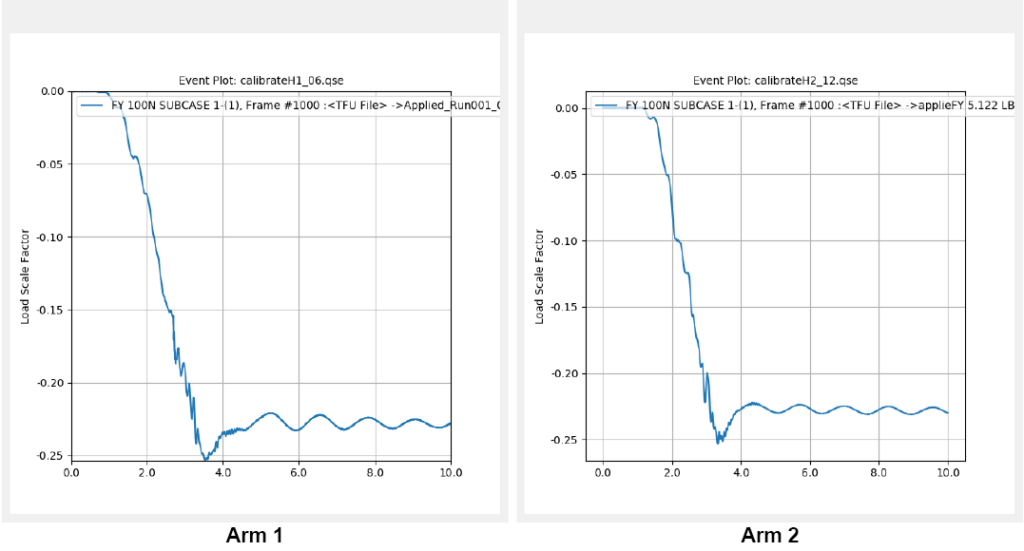
Using True-Load’s True-QSE software’s utilities, a Quasi Static Event (QSE) was created to apply the 5.122 Lbf load the way it was in test. This involved manipulation of True-Load/Post-Test calculation results, which will not be detailed here. Figure 11 shows the resulting load profiles that were created for each arm.
The True-QSE software allows users to compare virtual gauge response to test data. Figure 12 shows the study performed on Arm 1. The red curves in the plot indicate the “best” virtual gauge, the blue lines in plot represent the as-design location for the virtual gauge. The green curves represent the measured strain. Note that there still remains an error due to the out-of-plane loading created by the oscillation of the dead weight. Note that Gauge 1 on Arm 1 was damaged, non-functioning, and thus excluded from the plots.
The True-Load (TLD) files were updated with these new locations, and a confirmation calibration run was performed to ensure the proper dead weight was back-calculated. At this point, the two arms are ready for the in-use test on the wine bottles.
Test data collection
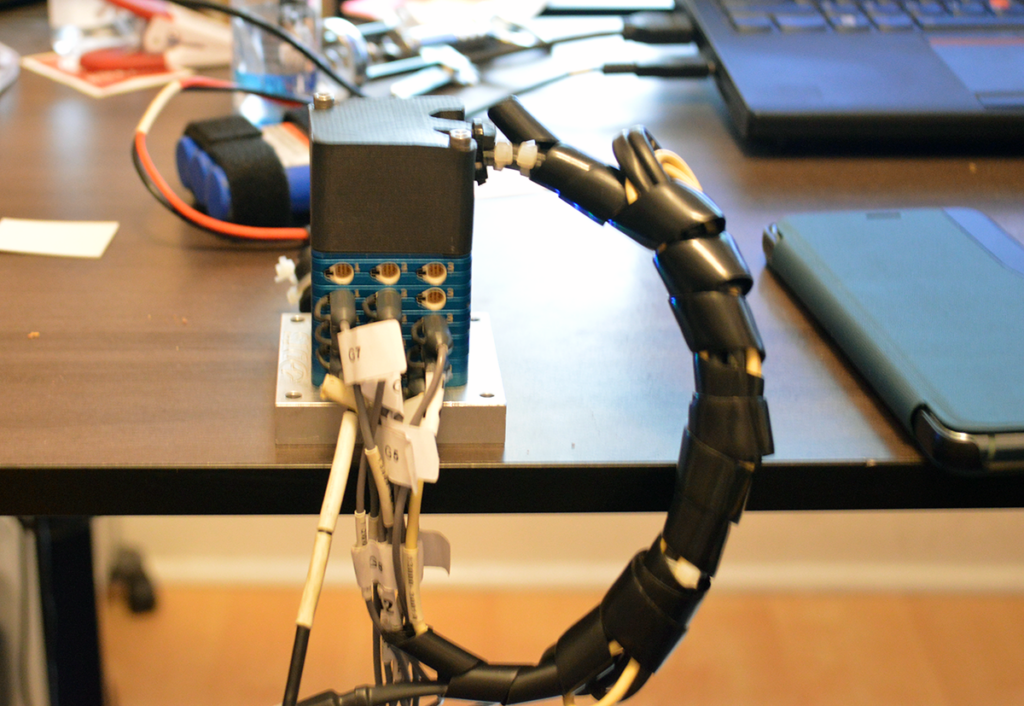
Once the corkscrew was fully instrumented and calibrated, the strain gauges were connected to a DTS Slice Micro DAQ system (Figure 13). The strain data was sampled at 1,000 samples per second.
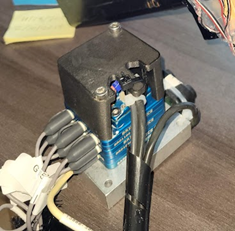
The data collection was performed while opening several bottles of wine. A typical trace of strain data is shown below.
Post-test
Once the strain data has been collected, it is processed to reconstruct the applied loading to the system. This is done by multiplying the measured strain data times the correlation matrix extracted from the FEA model. The result will be a time history of loading scale factors for each applied load to the corkscrew.
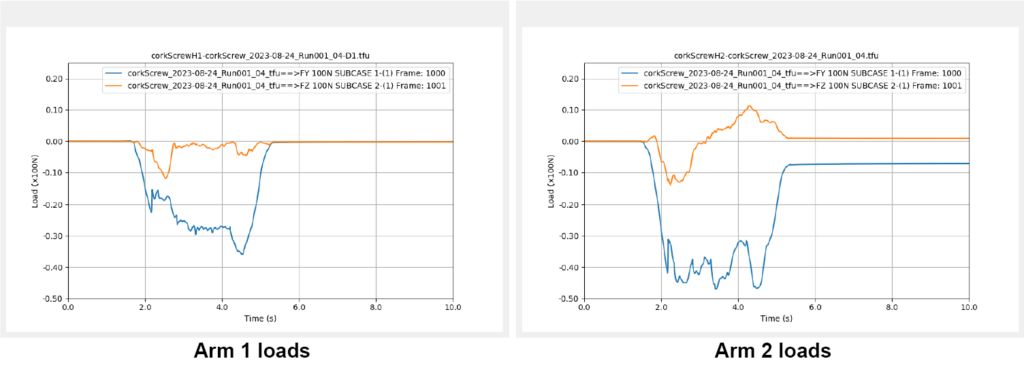
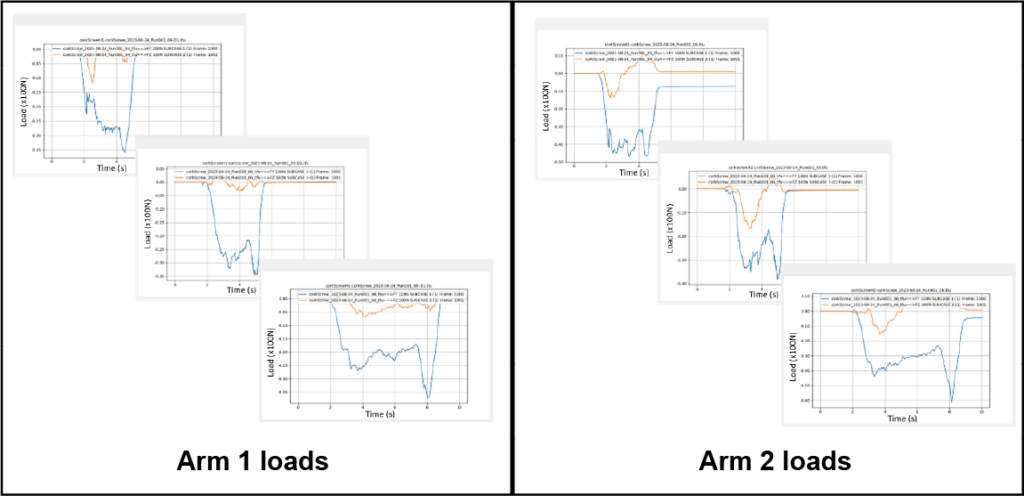
The load plots (Figure 15) illustrate that Arm 2 experiences about 48 N (10.8 Lbf) and Arm 1 experiences about 35 N (7.9 Lbf). Also, it is apparent from these traces that Arm 1 is being pushed in the negative Z direction, whereas Arm 2 is being pushed and pulled in the Z direction.
Three different corks on three different bottles were tested. As would be suspected, the loads for each bottle are different. Some of the corks were very tight in the bottle and others were easier to pull. Figure 16 shows how these loads differ from side to side and run by run.
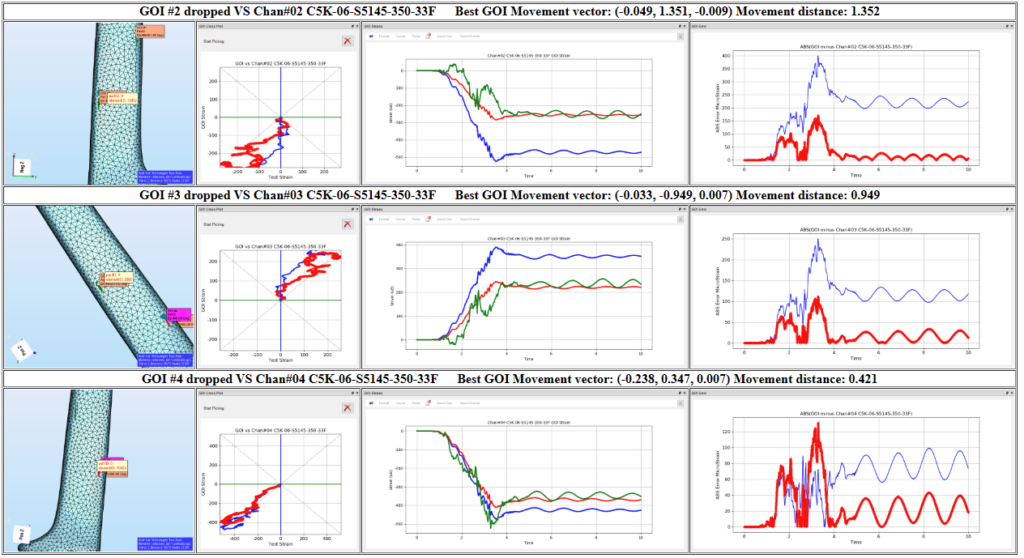
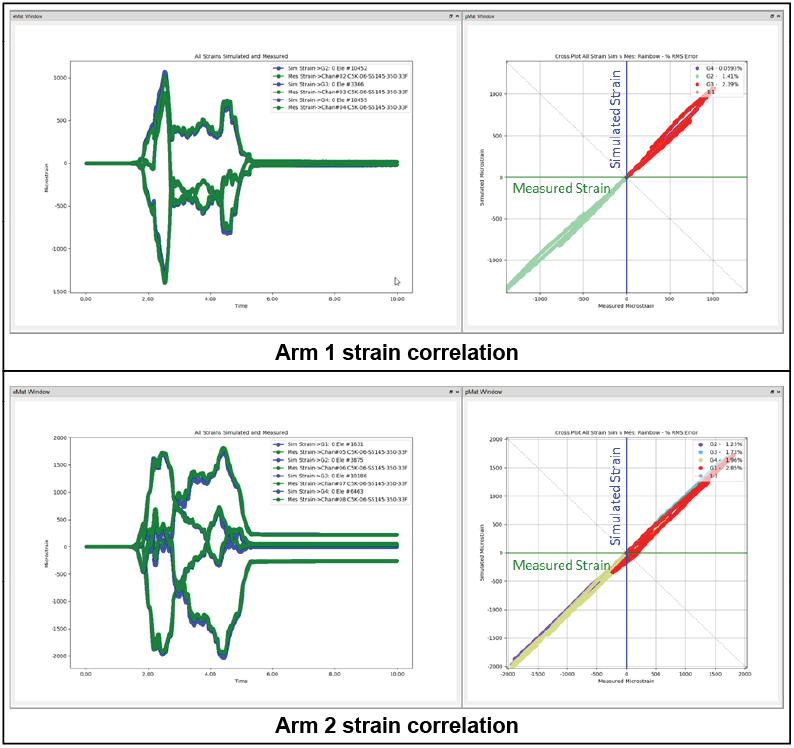
The True-Load/Post-Test software was used to perform this load reconstruction. In addition to the load reconstruction, several automatic post-processing tasks are performed. This will produce an HTML report that contains plots of the reconstructed loads and a set of plots showing the measured strain and simulated strain from the reconstructed loads at the strain gauge locations in the FEA model (Figure 17). These measured/simulated strain plots are summarized in an overall plot of the simulated strain (blue) and the measured strain (green). In addition, there will be a cross-plot of simulated vs. measured strain. Ideally, this would be a perfectly straight line on a 45-degree angle. Note that in the cross plots of strain, the maximum error in strain correlation is reported as a 2.85% RMS error.
Once there is confidence in the reconstructed loads, detailed post-processing of the FEA model may be performed. Having a complete time history of loads makes it possible to construct operating deflection shapes (ODS) of the corkscrew utilizing the time history of loading and the FEA model. Below is a typical plot of an arm from an operating deflection shape on the corkscrew.
Conclusion
This demonstration has illustrated that complex/nonlinear loading on a structure can be recovered at very high accuracy. The loading DOF were moderately complex (FY, FZ) on the two handles to make this a non-trivial problem. If traditional load measurement techniques were to be deployed, the corkscrew would have been rendered inoperable. A 2 DOF load transducer could perhaps be reasonably applied at the handles. However, a traditional load transducer would render the corkscrew unusable in a normal fashion.
With moderate skill and test plan processes, strain gauges can be efficiently placed on the structure to back-calculate virtually any load conceived of by the FEA analyst. The cost for calculating these loads is two uniaxial strain gauges per loading DOF, which is approximately $20 (USD). This is a highly cost-effective and efficient process for determining complex loading on structures.
See how True-Load software can be used to calculate other complex loading, such as on a trailer hitch. Want a first-hand look at True-Load or other Wolf Star software? Visit the company’s website to get started.
About the author
Tim Hunter, president and founder of Wolf Star Technologies, developed the first-to-market True-Load© suite of load reconstruction tools by leveraging 30 years of engineering experience. Tim’s True-Load software helps customers realize the full potential of their products by understanding real-world product loading.
Partners who build solutions
Wolf Star Technologies is a Siemens Digital Industries Software Software and Technology Partner. Software and Technology Partners utilize Siemens Xcelerator and its flexible open ecosystem by building technologies that complement the comprehensive digital twin and provide solutions tailored to meet the demands of mutual customers. In addition, Wolf Star Technologies develops, sells, supports, and markets hardware and software solutions that are interoperable with Siemens products and ensure infrastructure compatibility.