Verilog & VHDL Debug & Weeding
Automation in your Verilog and VHDL Debug
Verilog and VHDL Debug can get tedious trying to find causality. In this BLOG we discuss automation that can improve your productivity.
Weeding
Just off a weekend of weeding. Got me thinking about Debug and Weeding. I hate weeding. Debug not so much. Love debug. When I’m weeding I find bugs and spiders and sometimes California skinks. When I’m debugging, the same. Only nastier.
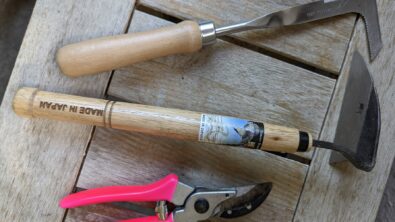
When I’m weeding, I always think…. I need a better tool.
First a screwdriver. Crude but effective. Then a better screwdriver – with a sharp edge and a hook. “Destruction” with a handle. Then a fancy sharpened short hoe – all the way from Japan. Really nice. Those weeds don’t stand a chance. But sometimes, when I run out of patience, the weed whacker. Total destruction.
As I gazed at the destruction on my lawn – all the drought tolerant plants amongst the weeds… I realize. Weeding is just like debug. Sharp tools to the rescue.
Verilog Debug
I always want a better tool. When the tools aren’t available, I resort to $display. As useful as $display is, it’s not really debug, so much as logging with correlation in your mind. Cause and Effect By Hand. There are much better tools. Sharper.
Over the next few blogs, we’ll work through some useful debug tools. Today we work on tracing backwards in time and space to find drivers.
Driver Tracing
- See an edge. Wonder WHO caused it? Double Click on the edge.
- See a variable in the source code window (when it is changing). Double Click on the variable name.
Waveform Edge
Chasing down the driver of an edge in the wave window. Double click the edge.

Active Driver and Driver List
Double clicking that edge in the waveform takes you right to the source code line that caused the change and shows a report.
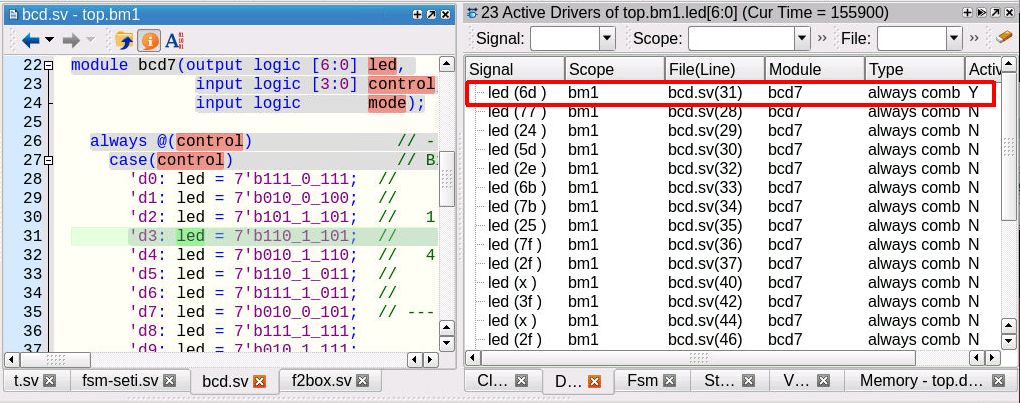
Double click in the source code window. Go to the driver. Double click in again and keep tracing to find the cause.
Nice.
Logic Cone
What about seeing the driver tracing in a schematic or logic cone?
I can put a signal in the logic cone, and click, click, click. But that gets old quickly.
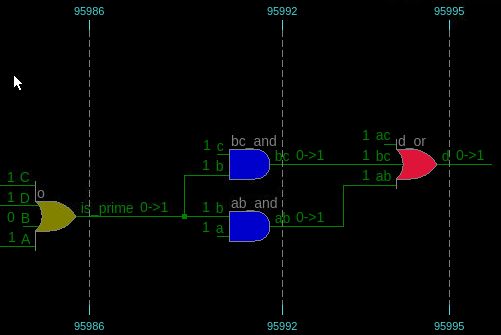
Time Cone
Instead of going backwards in time by hand, and guessing which way to go, we can use our automation to trace back through time – moving back and showing cause – automatically. Just select a signal at a transition and Show Time Cone. It draws automatically. Here’s a picture zoomed in at the right side of the cone of influence.
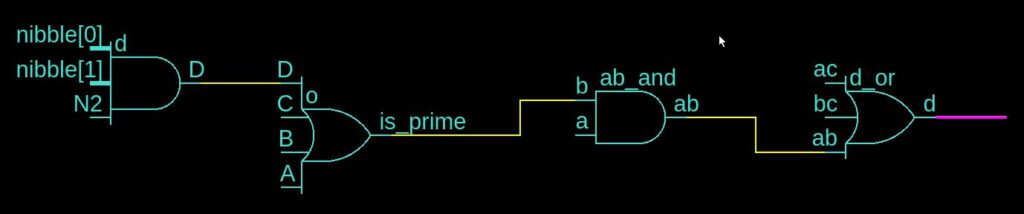
Or we can have a look at the whole chain by zooming out.
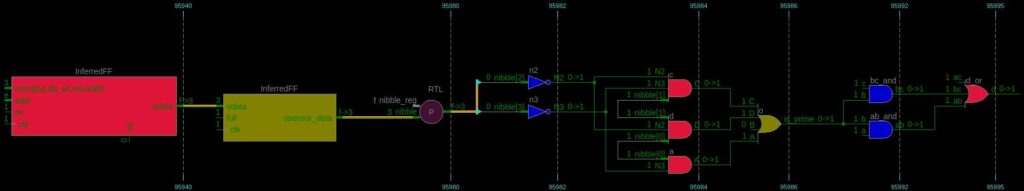
Clicking on the output signal of that red box on the left will highlight the “logic” that caused the transition.
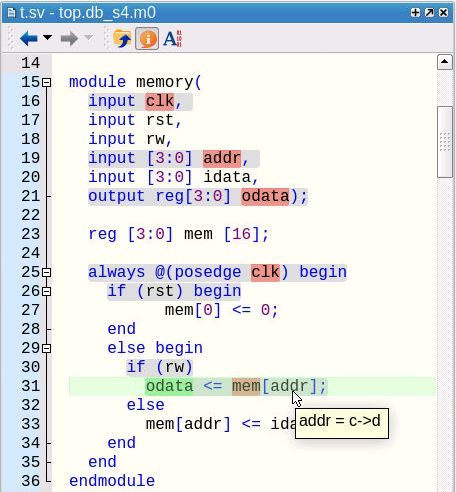
Nice. Debug can continue. The execution trace shows us the code that executed (back in time when that transition happened). That address used in line 31 may not be the right address, or the value in the memory at that address may be wrong. We can trace back from the memory – that’s a story for another day.
In debug, just like when you are weeding – use those sharp tools. Those weeding tools saved my sanity and weekend. I hope Visualizer Debug can save your sanity and weekend.
You can find more about Visualizer Debug Environment in the Verification Horizons article from our DVCON Edition at Verification Horizons DVCON 2022 Edition – Getting To Know Visualizer (Part 1). That’s part 1. Part 2 will be available with the Verification Horizons DAC 2022 Edition.
Safe debugging.
And no one gets hurt. Not even a skink.