Part 11: The 2020 Wilson Research Group Functional Verification Study

This blog is a continuation of a series of blogs related to the 2020 Wilson Research Group Functional Verification Study. In my previous blog I presented our study findings on various verification language and library adoption trends. In this blog, I focus on low power trends.
ASIC/IC Low Power Trends
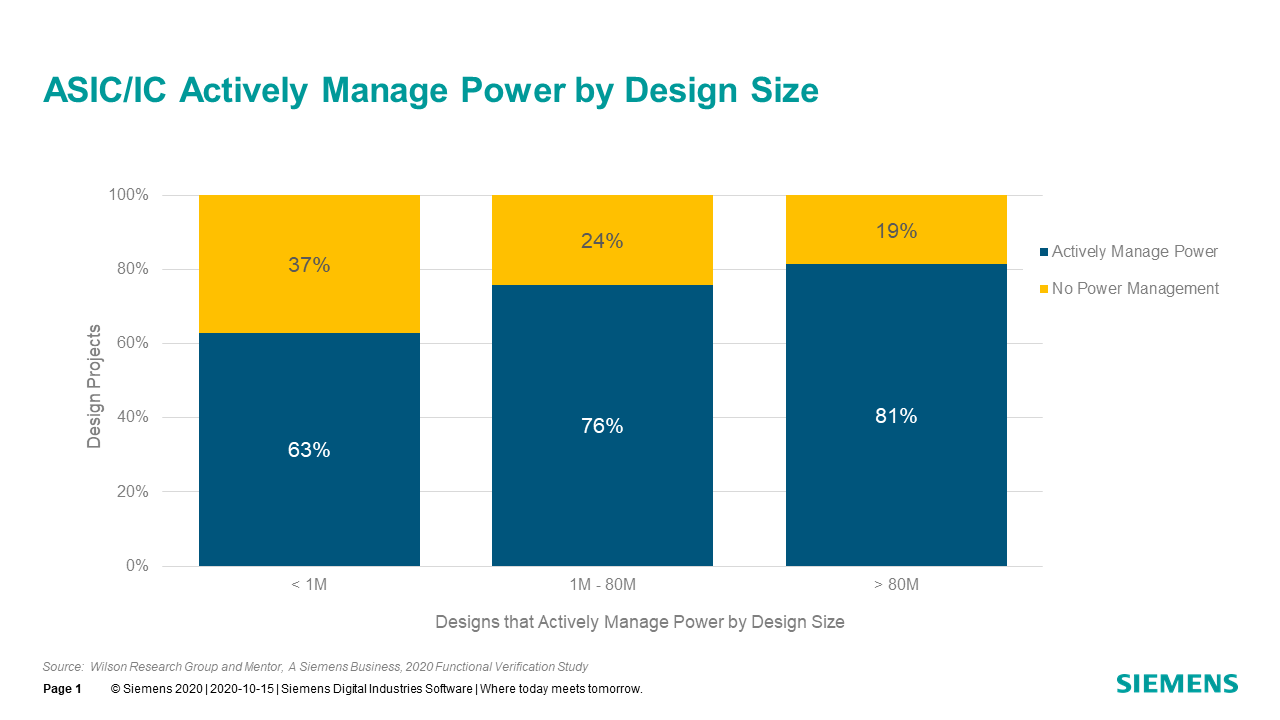
In figure 11-1, we see that the percentage of design projects who actively manage power by design size. The data suggest that the larger the design, the greater the concern for power management. Obviously, a wide variety of techniques, ranging from simple clock-gating, to complex hypervisor/OS-controlled power management schemes are employed whose requirements require verification.

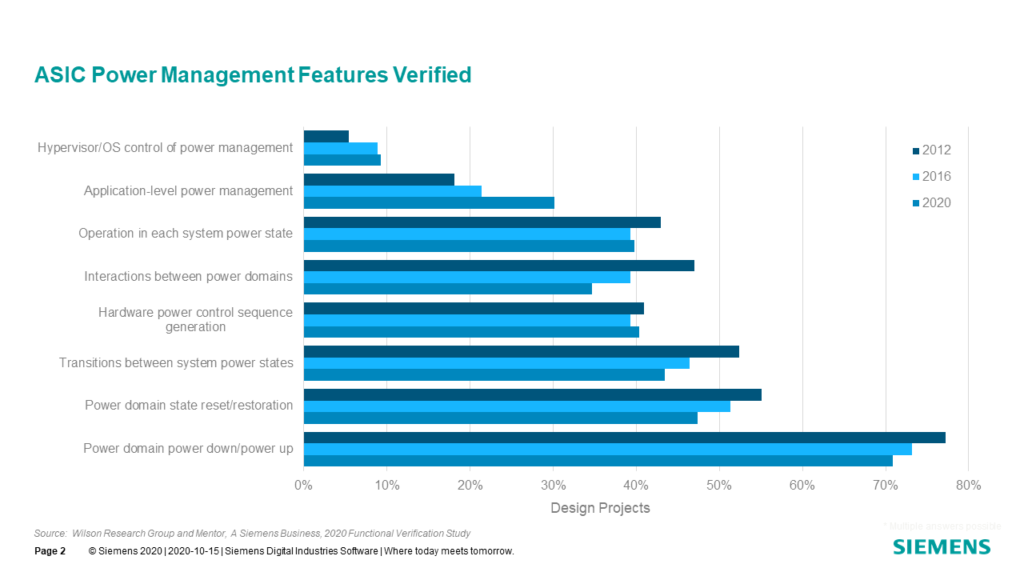
Figure 11-2 shows the various aspects of power-management that design projects must verify. The data from our study suggest that many projects, since 2012, have moved to more complex power-management schemes that involve software control (e.g., hypervisor/OS control and application-level power management). This adds a new layer of complexity to a project’s verification challenges, since these more complex power management schemes often require emulation for complete verification.

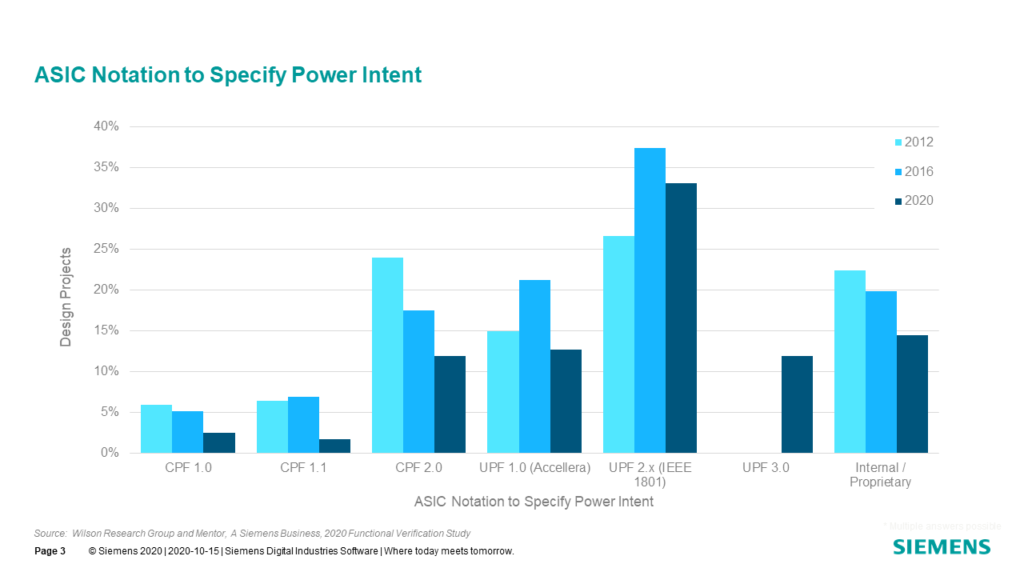
Since the power intent cannot be directly described in an RTL model, alternative supporting notations have recently emerged to capture the power intent. In the 2020 study, we wanted to get a sense of where the industry stands in adopting these various notations. For projects that actively manage power, Figure 11-3 shows the various standards used to describe power intent that have been adopted. You might note that the that the newer UPF 3.0 standard was tracked in 2020. Also, some projects are actively using multiple standards (such as different versions of UPF or a combination of CPF and UPF). That’s why the adoption results do not sum to 100 percent.

In an earlier blog in this series, I provided data that suggest a significant amount of effort is being applied to IC/ASIC functional verification. An important question the various studies have tried to answer is whether this increasing effort is paying off. In my next blog, I present verification results findings in terms of schedules, number of required spins, and classification of functional bugs.
Quick links to the 2020 Wilson Research Group Study results
- Prologue: The 2020 Wilson Research Group Functional Verification Study
- Understanding and Minimizing Study Bias (2020 Study)
- Part 1 – FPGA Design Trends
- Part 2 – FPGA Verification Effectiveness Trends
- Part 3 – FPGA Verification Effort Trends
- Part 4 – FPGA Verification Effort Trends (Continued)
- Part 5 – FPGA Verification Technology Adoption Trends
- Part 6 – FPGA Verification Language and Library Adoption Trends
- Part 7 – IC/ASIC Design Trends
- Part 8 – IC/ASIC Resource Trends
- Part 9 – IC/ASIC Verification Technology Adoption Trends
- Part 10 – IC/ASIC Language and Library Adoption Trends
- Part 11 – IC/ASIC Power Management Trends
- Part 12 – IC/ASIC Verification Results Trends
- Conclusion: The 2020 Wilson Research Group Functional
- Epilogue: The 2020 Wilson Research Group Functional Verification Study


Comments