Part 8: The 2020 Wilson Research Group Functional Verification Study
IC/ASIC Resource Trends
This blog is a continuation of a series of blogs related to the 2020 Wilson Research Group Functional Verification Study. In my previous blog, I presented trends related to various aspects of design to illustrate growing design complexity. In this blog, I plan to discuss the growing IC/ASIC project resource trends resulting from growing design complexity.
Percentage of Project Time Spent in Verification
Figure 8-1 shows the percentage of total IC/ASIC project time spent in verification. You can see two extremes in this graph. In general, projects that spend very little time in verification are typically working on designs with a good deal of existing pre-verified design IP, which is integrated to create a new product. On the other extreme, projects that spend a significant amount of time in verification often have a high percentage of newly developed design IP that must be verified.
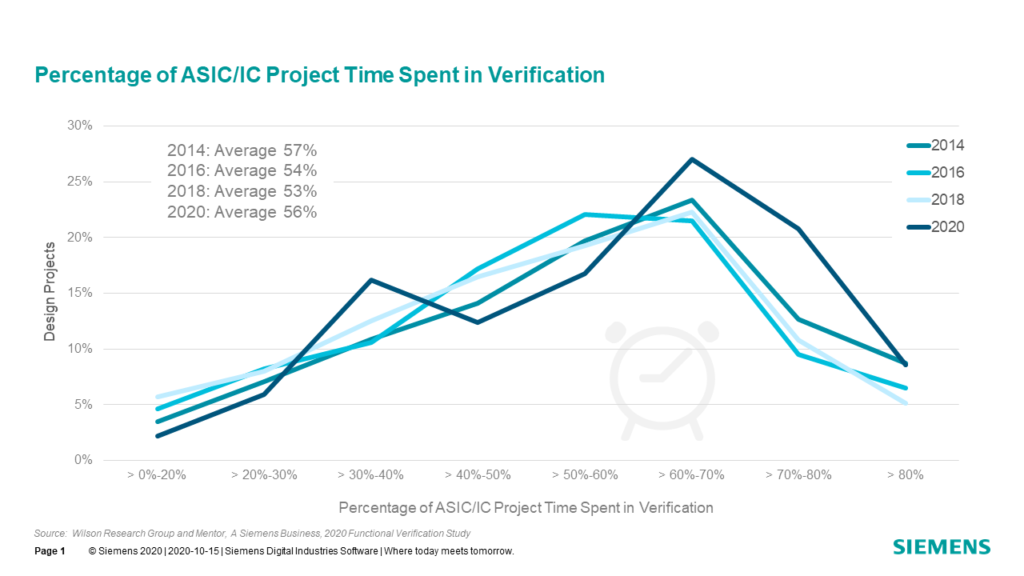
Notice the increase in project times greater than 60 percent for this year’s study. Again, this is a potential indication of growing design and verification complexity.
Mean Peak Number of Engineers
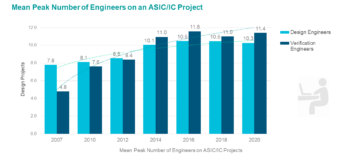
Perhaps one of the biggest challenges today is to control cost and engineering headcount, which means identifying IC/ASIC design and verification solutions that increase productivity. To illustrate the need for productivity improvement, we discuss the trend in terms of increasing engineering headcount. Fig. 8-2 shows the mean peak number of IC/ASIC engineers working on a project.
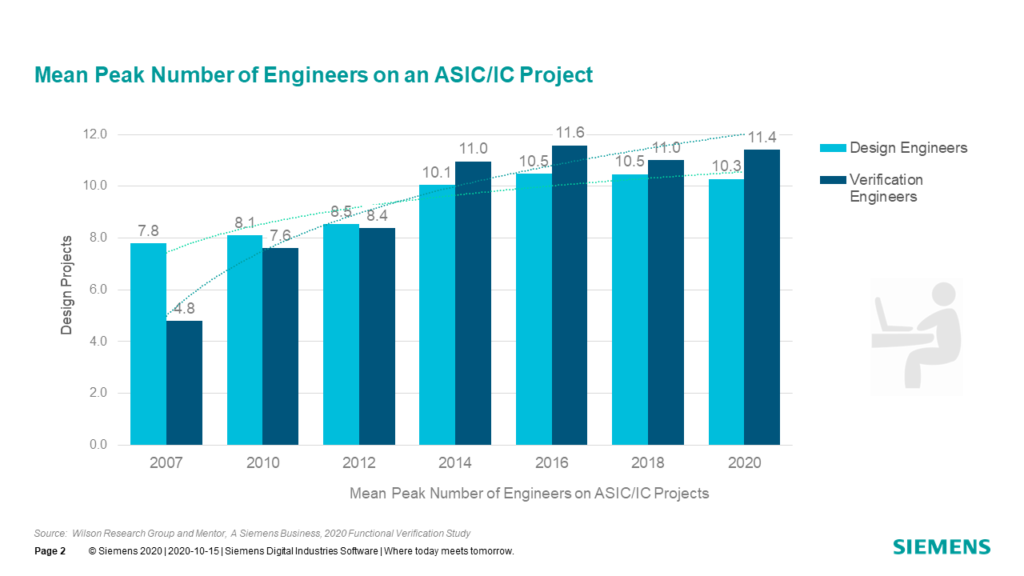
While, on average, the demand for IC/ASIC design engineers grew at about a 3 percent CAGR between 2007 and 2020, the demand for IC/ASIC verification engineers grew at a 6.8 percent CAGR. Today, on average, across all market segments, we find about a one-to-one ratio in terms of mean peak number of verification and design engineers. However, in some market segments, such as processors, it is not unusual to find a 5-to-1 ratio.
Where Design Engineers Spend Their Time
But verification engineers are not the only project stakeholders involved in the verification process. Design engineers spend a significant amount of their time in verification too, as shown in fig. 8-3.
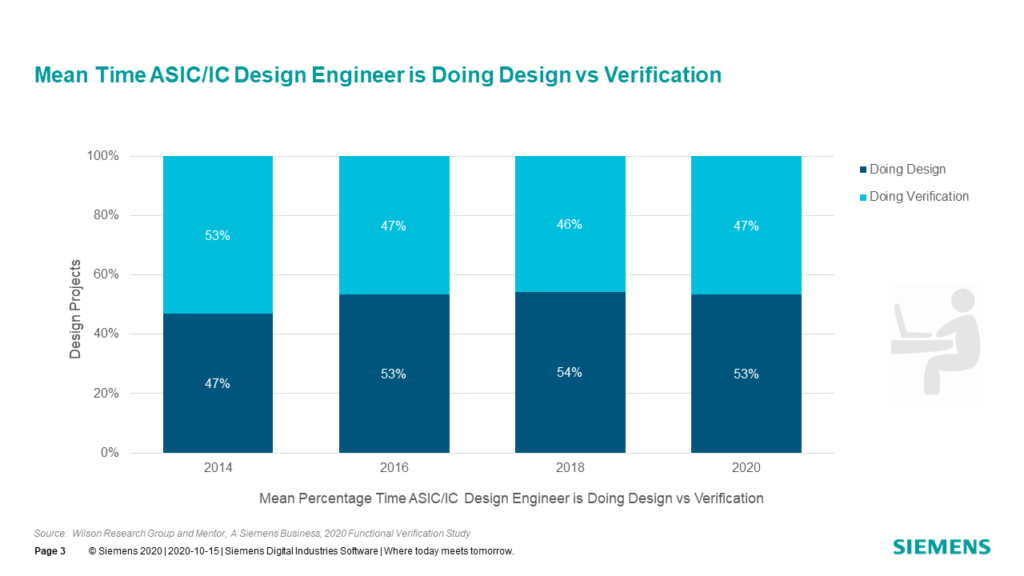
In 2020, design engineers spent on average 53 percent of their time involved in design activities and 47 percent of their time in verification. However, when compared to 2014, the data indicate a trend showing that IC/ASIC design engineers are now spending slightly less time involved in verification tasks.
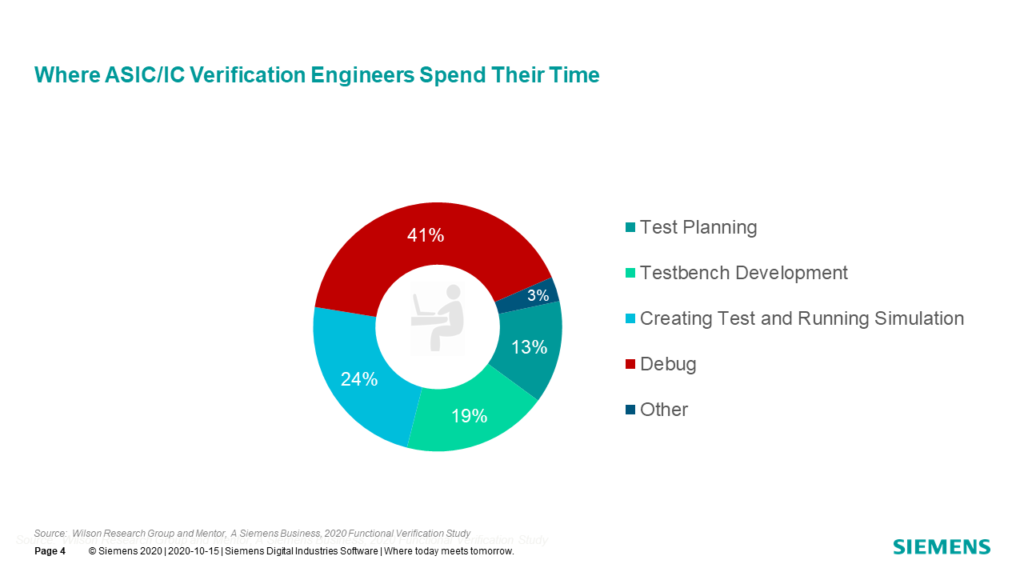
Where Verification Engineers Spend Their Time
Fig. 8-4 shows where verification engineers spend their time (on average) for various task. Our study found that IC/ASIC verification engineers spend more of their time debugging than with any other activity. From a management perspective, this can be a significant challenge when planning future projects’ effort and schedule based on previous projects’ data since debugging is unpredictable and varies significantly between projects.
In my next blog I plan to discuss various IC/ASIC verification technology adoption trends.
Quick links to the 2020 Wilson Research Group Study results
- Prologue: The 2020 Wilson Research Group Functional Verification Study
- Understanding and Minimizing Study Bias (2020 Study)
- Part 1 – FPGA Design Trends
- Part 2 – FPGA Verification Effectiveness Trends
- Part 3 – FPGA Verification Effort Trends
- Part 4 – FPGA Verification Effort Trends (Continued)
- Part 5 – FPGA Verification Technology Adoption Trends
- Part 6 – FPGA Verification Language and Library Adoption Trends
- Part 7 – IC/ASIC Design Trends
- Part 8 – IC/ASIC Resource Trends
- Part 9 – IC/ASIC Verification Technology Adoption Trends
- Part 10 – IC/ASIC Language and Library Adoption Trends
- Part 11 – IC/ASIC Power Management Trends
- Part 12 – IC/ASIC Verification Results Trends
- Conclusion: The 2020 Wilson Research Group Functional
- Epilogue: The 2020 Wilson Research Group Functional Verification Study

Comments