Part 6: The 2018 Wilson Research Group Functional Verification Study
FPGA Language and Library Trends
This blog is a continuation of a series of blogs related to the 2018 Wilson Research Group Functional Verification Study (click here). In my previous blog (click here) I discussed FPGA verification techniques and technologies adoption trends, as identified by the 2018 Wilson Research Group study. In this blog, I’ll present FPGA design and verification language adoption trends.
It is not uncommon for FPGA projects to use multiple languages when constructing their RTL and testbenches. This practice is often due to legacy code as well as purchased IP. Hence, you might note that the percentage adoption for some of the languages that I present sums to more than one hundred percent.
FPGA RTL Design Language Adoption Trends
Let’s begin by examining the languages used for FPGA RTL design. Figure 6-1 shows the trends in terms of languages used for design, by comparing the 2012, 2014, 2016, and 2018 Wilson Research Group study, as well as the projected design language adoption trends within the next twelve months. Note that the language adoption is flat or declining for most of the languages used for FPGA RTL design with the exception of Verilog and SystemVerilog.
Also, it’s important to note that this study focused on languages used for RTL design. We have conducted a few informal studies related to languages used for architectural modeling—and it’s not too big of a surprise that we see increased adoption of C/C++ and SystemC in that space. However, since those studies have (thus far) been informal and not as rigorously executed as the Wilson Research Group study, I have decided to withhold that data until a more formal study can be executed related to architectural modeling and virtual prototyping.
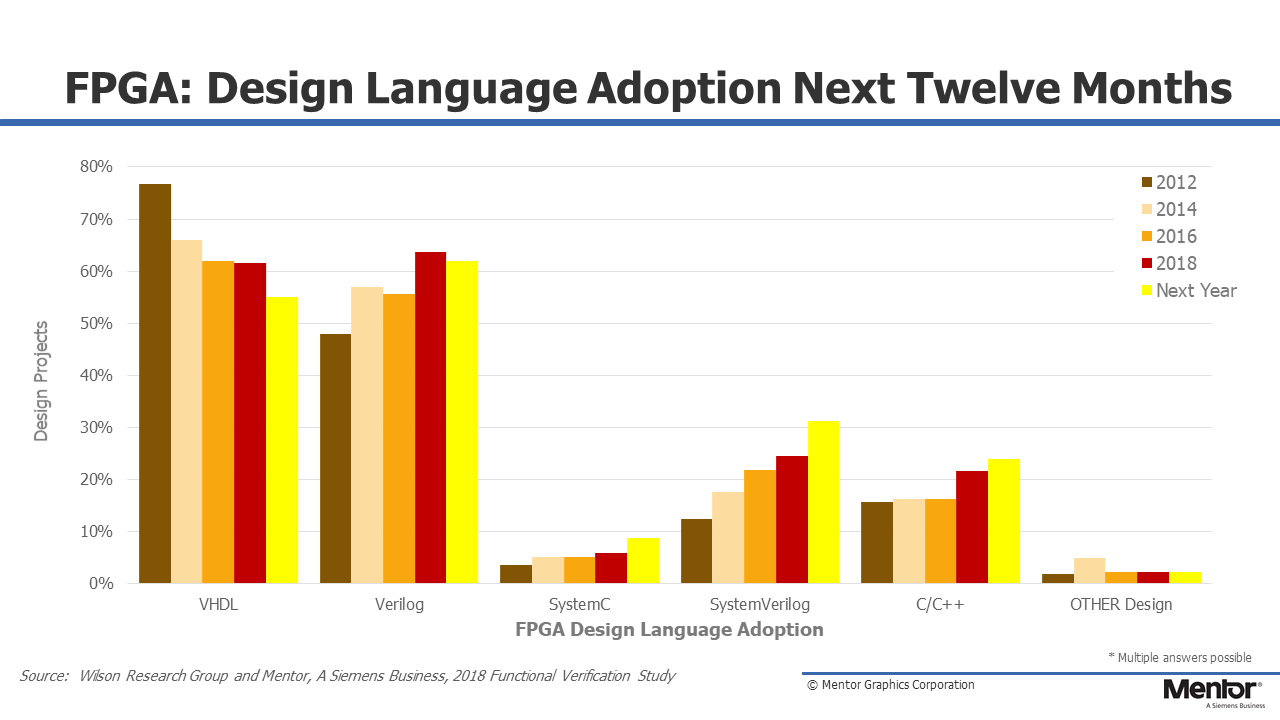
Figure 6-1. Trends in languages used for FPGA design
VHDL has historically been predominant language used for FPGA RTL design, although it is slowly declining when viewed as a worldwide trend. An important note here is that if you were to filter the results down by a particular market segment or region of the world, you would find different results. For example, if you only look at Europe, you would find that VHDL adoption as an FPGA RTL design language is about 78 percent, while the world average is 62 percent. However, I believe that it is important to examine worldwide trends to get a sense of where the overall industry is moving in the future in terms of design ecosystems.
FPGA Verification Language Adoption Trends
Next, let’s look at the languages used to verify FPGA designs (that is, languages used to create simulation testbenches). Figure 6-2 shows the trends in terms of verification languages used to create simulation testbenches by comparing the 2012, 2014, 2016, and 2018 Wilson Research Group study, as well as the projected verification language adoption trends within the next twelve months.
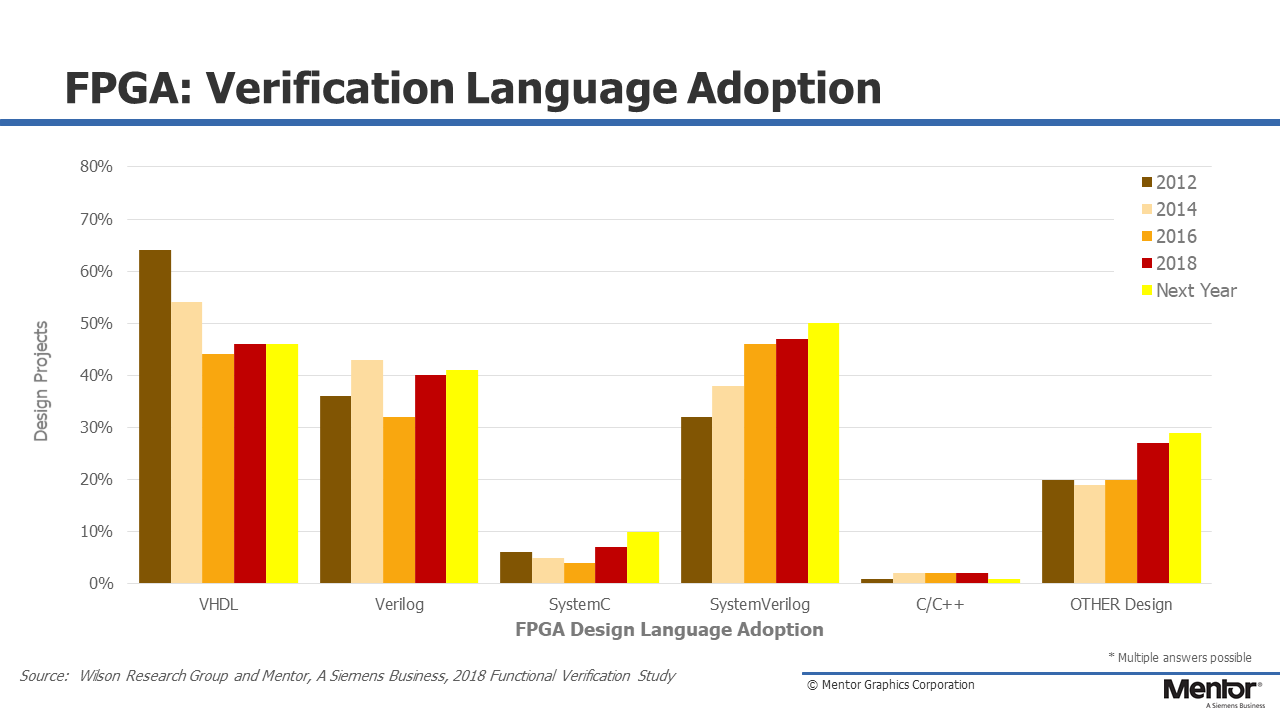
Figure 6-2. Trends in languages used in verification to create FPGA simulation testbenches
Historically, VHDL was the predominant language for FPGA testbenches, yet it has leveled off to about 45% adoption, and have seen an increase in SystemVerilog adoption. Today, it is not unusual that the RTL design was created using VHDL, and the testbench was created using SystemVerilog. The increase in “Other” in 2018 is due to the recent adoption of various scripting languages by various FPGA projects (e.g., Python). Finally, the downward trend in VHDL and Verilog adoption in 2016 was probably an anomaly in the study. It is more likely that adoption has only slightly declined or remained flat in 2016.
FPGA Testbench Methodology Class Library Adoption Trends
The adoption trends for various base-class library and methodology standards are shown in Fig. 6-3, and we found that the Accellera UVM is currently the predominant standard that has been adopted to create FPGA testbenches worldwide. You might note that we are not showing historical trends for the Open Source VHDL Verification Methodology™ (OSVVM) and the Universal VHDL Verification Methodology (UVVM) since 2018 was the first year we tracked these methodologies.
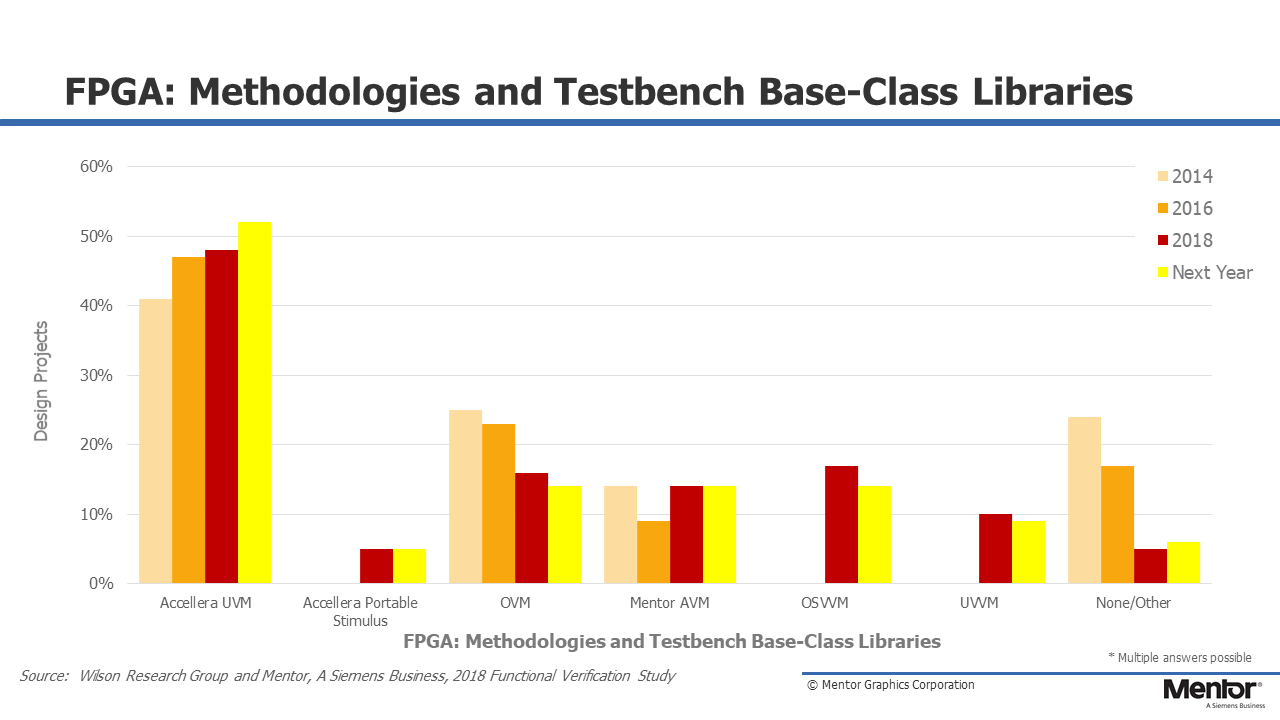
Figure 6-3. FPGA methodology and class library adoption trends
As I previously stated, if you were to filter the results down by a particular market segment or region of the world, you would find different results. For example, we found that worldwide about 17 percent of the study participants have adopted OSVVM while 10 percent of projects have adopted UVVM. Yet, if you filter the results to the specific region of Europe then you will find that 30 percent of the Europe participants have adopted OSVVM while 26 percent have adopted UVVM.
FPGA Assertion Language and Library Adoption Trends
Finally, FPGA project adoption trends for various assertion language standards are shown in Fig. 6-4, where SystemVerilog Assertions (SVA) is the predominate language. Similarly to languages used to build testbenches, it is not unusual to find FPGA projects create their RTL in VHDL and then create their assertions using SVA.
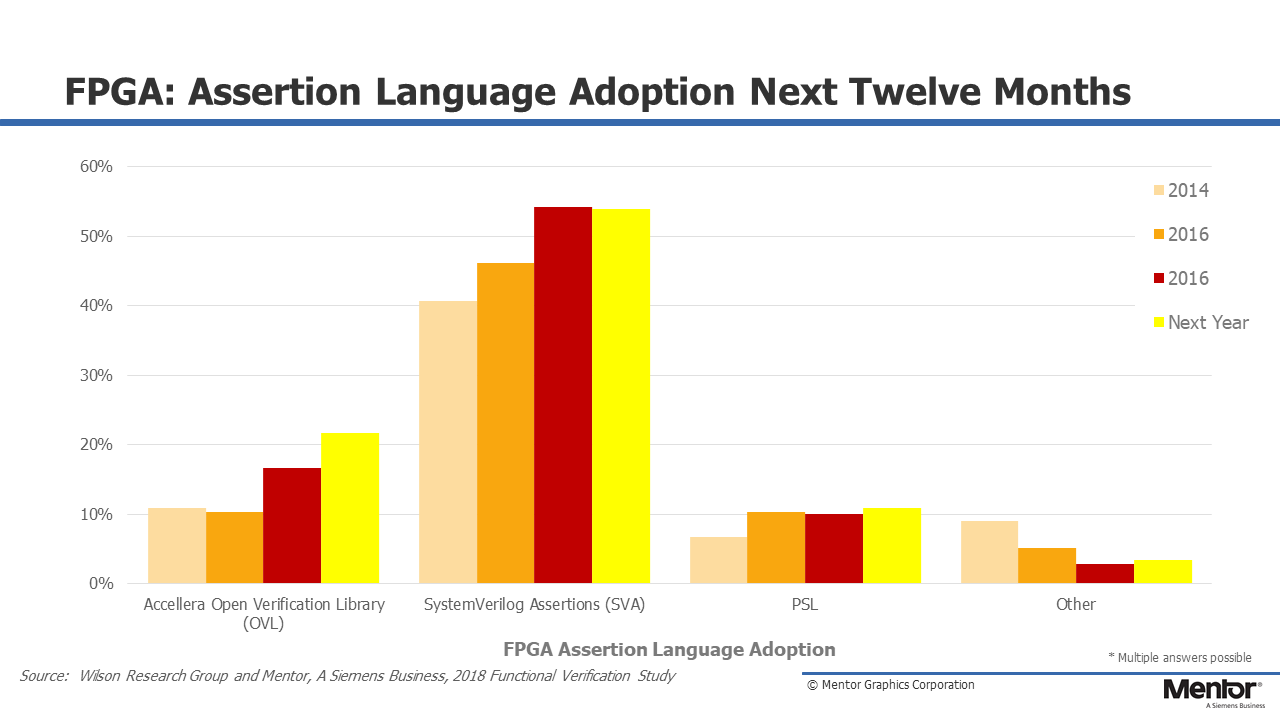
Figure 6-4. Trends in assertion language and library adoption for FPGA designs
In my next blog (click here), I will shift the focus from FPGA trends and start to present the IC/ASIC findings from the 2018 Wilson Research Group Functional Verification Study.
Quick links to the 2018 Wilson Research Group Study results
- Prologue: The 2018 Wilson Research Group Functional Verification Study
- Understanding and Minimizing Study Bias (2018 Study)
- Part 1 – FPGA Design Trends
- Part 2 – FPGA Verification Effectiveness Trends
- Part 3 – FPGA Verification Effort Trends
- Part 4 – FPGA Verification Effort Trends (Continued)
- Part 5 – FPGA Verification Technology Adoption Trends
- Part 6 – FPGA Verification Language and Library Adoption Trends
- Part 7 – IC/ASIC Design Trends
- Part 8 – IC/ASIC Resource Trends
- Part 9 – IC/ASIC Verification Technology Adoption Trends
- Part 10 – IC/ASIC Language and Library Adoption Trends
- Part 11 – IC/ASIC Power Management Trends
- Part 12 – IC/ASIC Verification Results Trends
- Conclusion: The 2018 Wilson Research Group Functional
Comments
Leave a Reply
You must be logged in to post a comment.
From the prediction of FPGA methodology and class library adoption I can see that UVM is on the rise, PS and AVM is standing still while OVM, OSVVM and UVVM are declining. What about the None/Other category. After a rapid decline it’s on the rise again. What are the upcoming trends hiding in that category?
It would be interesting to see *ANY* reasoning behind the indication that UVVM is declining. UVVM has been by far the fastest growing verification methodology over the last two years. Going from almost 0 to 10% in two years is an extreme growth. Lots of designers are currently hearing about UVVM for the first time. Lots of designers have given very positive feedback, but were waiting to see if the community was growing beyond a few hundred…. Reaching 10% world-wide means it is now a huge community. Users now see how they manage to significantly speed up their FPGA verification and drastically improve their reuse. It has really only just started. Who concluded on ‘Declining’….???
I think these studies ask for people’s future plans. That’s why they expect a decline in OVM, OSVVM and UVVM. That’s also why I was curious about people’s plans for libraries in the none/other category.
Why do you say UVVM had no users two years ago. It was not included in the previous study. That’s why there is no data. UVVM is an extension of Bitvis Utility Library which has been around for a long time. Not sure how much it has been used. At github there seem to be more interest and activity around cocotb (https://github.com/potentialventures/cocotb) and vunit (https://github.com/VUnit/vunit)
The open source world has its own metrics to rank projects which can be interesting to extend the findings from the Wilson study, especially for projects not included in the study.
The most common metric is the number of stars/likes a project has. Github hosts several of the mention projects and have the following information:
1. cocotb – 325 stars
2. VUnit – 276 stars
3. UVVM – 89 stars
4. OSVVM – 71 stars
But what does the number of stars tells us? How many bother to click the like button? Is it at all correlated to the number of users? Maybe it’s correlated to the quality of the project? Or the number of friends the main developers have?
By looking at the profiles of these people you can get some insight: Are they working with the developers, are they students or professionals, are they engineers or marketing people, what type of companies are they working for etc.
I’m one of two main developers for VUnit and I would say that about 10 of the persons endorsing our project would be part of our personal networks regardless of VUnit and one of them is not even an engineer that would use the tool. On the other hand, out of the 11 FPGA engineers working close to me on a daily basis only one starred the project. Caution: This is only one data point and one that you cannot verify. It’s healthy to stay skeptic about such information.
Stars also accumulate over time and if people stop using the tool they are not likely to remove their star. Some insights can be gained by looking at the star trend over time. Has it leveled off? You can look at the trend for these project here (you may have to reload a few times to get access): https://star-history.t9t.io/#vunit/vunit&potentialventures/cocotb&osvvm/osvvm&uvvm/uvvm
Other interesting metrics are the number of people that have contributed with code, the number of pull requests (requests to have code accepted), the number of opened issues. This is an indication of how involved the users are in continuing to build on the tool capabilities and investing their own time in making that happen.
1. cocotb – 47/340/493
2. VUnit – 36/150/304
3. UVVM – 5/15/58
4. OSVVM – 2/10/25
It’s also interesting to look at who is contributing. If you do you will see that the people that developed the code for cocotb, UVVM and OSVVM also made contributions to VUnit and there are people using UVM that made contributions to have VUnit provide a higher level of automation of UVM testbenches. VUnit also includes OSVVM for its constrained random features that VUnit do not provide. There is certainly overlapping functionality in these frameworks and a need to decide what solutions you favor but the most capable solution comes from combining tools.
Finally, another interesting metric is the source ranking provided by libraries.io. It’s an overall quality metric that combines the metrics above and some others:
1. VUnit – 9
2. cocotb – 7
3. UVVM – 6
3. OSVVM – 6
So what conclusions can be made? I’m leaving that to you. With **publicly available data** you can draw your own conclusions and any claims made based on that data can be reviewed by others for validity.