Part 6: The 2016 Wilson Research Group Functional Verification Study
FPGA Language and Library Trends
This blog is a continuation of a series of blogs related to the 2016 Wilson Research Group Functional Verification Study (click here). In my previous blog (click here), I focused on FPGA verification techniques and technologies adoption trends, as identified by the 2016 Wilson Research Group study. In this blog, I’ll present FPGA design and verification language trends.
You might note that the percentage for some of the language that I present sums to more than one hundred percent. The reason for this is that many FPGA projects today use multiple languages.
FPGA RTL Design Language Adoption Trends
Let’s begin by examining the languages used for FPGA RTL design. Figure 1 shows the trends in terms of languages used for design, by comparing the 2012, 2014, and 2016 Wilson Research Group study, as well as the projected design language adoption trends within the next twelve months. Note that the language adoption is declining for most of the languages used for FPGA design with the exception of Verilog and SystemVerilog.
Also, it’s important to note that this study focused on languages used for RTL design. We have conducted a few informal studies related to languages used for architectural modeling—and it’s not too big of a surprise that we see increased adoption of C/C++ and SystemC in that space. However, since those studies have (thus far) been informal and not as rigorously executed as the Wilson Research Group study, I have decided to withhold that data until a more formal study can be executed related to architectural modeling and virtual prototyping.
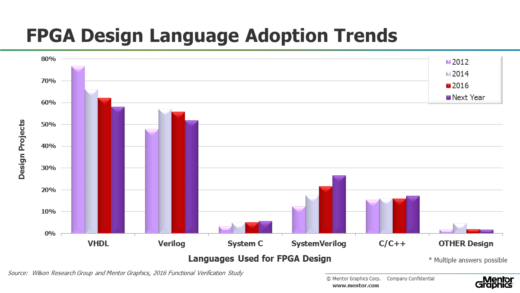
Figure 1. Trends in languages used for FPGA design
It’s not too big of a surprise that VHDL is the predominant language used for FPGA RTL design, although it is slowly declining when viewed as a worldwide trend. An important note here is that if you were to filter the results down by a particular market segment or region of the world, you would find different results. For example, if you only look at Europe, you would find that VHDL adoption as an FPGA design language is about 79 percent, while the world average is 62 percent. However, I believe that it is important to examine worldwide trends to get a sense of where the industry is moving in the future.
FPGA Verification Language Adoption Trends
Next, let’s look at the languages used to verify FPGA designs (that is, languages used to create simulation testbenches). Figure 2 shows the trends in terms of languages used to create simulation testbenches by comparing the 2012, 2014, and 2016 Wilson Research Group study, as well as the projected verification language adoption trends within the next twelve months.
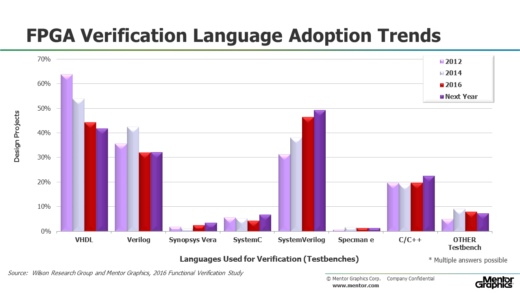
Figure 2. Trends in languages used in verification to create FPGA simulation testbenches
What is interesting in 2016 is that SystemVerilog overtook VHDL as the language of choice for building FPGA testbenches. But please note that the same comment related to design language adoption applies to verification language adoption. That is, if you were to filter the results down by a particular market segment or region of the world, you would find different results. For example, if you only look at Europe, you would find that VHDL adoption as an FPGA verification language is about 66 percent (greater than the worldwide average), while SystemVerilog adoption is 41 percent (less than the worldwide average).
FPGA Testbench Methodology Class Library Adoption Trends
Now let’s look at testbench methodology and class library adoption for FPGA designs. Figure 3 shows the trends in terms of methodology and class library adoption by comparing the 2012, 2014, and 2016 Wilson Research Group study, as well as the projected verification language adoption trends within the next twelve months.
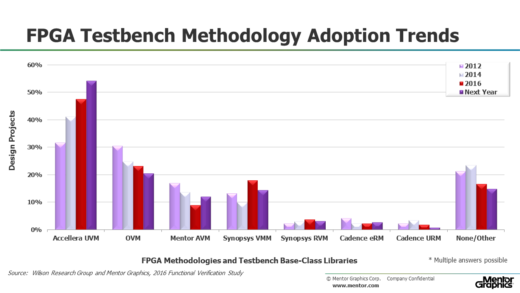
Figure 3. FPGA methodology and class library adoption trends
Today, we see a basically a flat or downward trend in terms of adoption of all testbench methodologies and class libraries with the exception of UVM, which has been growing at a healthy 10.7 percent compounded annual growth rate. The study participants were also asked what they plan to use within the next 12 months, and based on the responses, UVM is projected to increase an additional 12.5 percent.
By the way, to be fair, we did get a few write-in methodologies, such as OSVVM and UVVM that are based on VHDL. I did not list them in the previous figure since it would be difficult to predict an accurate adoption percentage. The reason for this is that they were not listed as a selection option on the original question, which resulted in a few write-in answers. Nonetheless, the data suggest that the industry momentum and focused has moved to SystemVerilog and UVM.
FPGA Assertion Language and Library Adoption Trends
Finally, let’s examine assertion language and library adoption for FPGA designs. The 2016 Wilson Research Group study found that 47 percent of all the FPGA projects have adopted assertion-based verification (ABV) as part of their verification strategy. The data presented in this section shows the assertion language and library adoption trends related to those participants who have adopted ABV.
Figure 4 shows the trends in terms of assertion language and library adoption by comparing the 2012, 2014, and 2016 Wilson Research Group study, and the projected adoption trends within the next 12 months. The adoption of SVA continues to increase, while other assertion languages and libraries are not trending at significant changes.
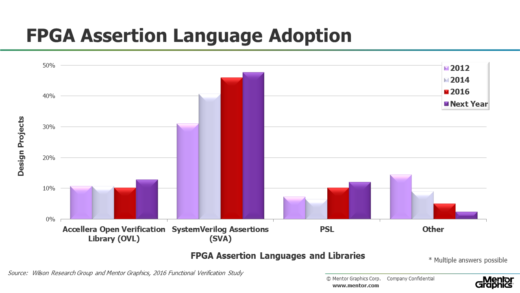
Figure 4. Trends in assertion language and library adoption for FPGA designs
In my next blog (click here), I will shift the focus of this series of blogs and start to present the ASIC/IC findings from the 2016 Wilson Research Group Functional Verification Study.
Quick links to the 2016 Wilson Research Group Study results
- Prologue: The 2016 Wilson Research Group Functional Verification Study
- Understanding and Minimizing Study Bias (2016 Study)
- Part 1 – FPGA Design Trends
- Part 2 – FPGA Verification Effort Trends
- Part 3 – FPGA Verification Effort Trends (Continued)
- Part 4 – FPGA Verification Effectiveness Trends
- Part 5 – FPGA Verification Technology Adoption Trends
- Part 6 – FPGA Verification Language and Library Adoption Trends
- Part 7 – ASIC/IC Design Trends
- Part 8 – ASIC/IC Resource Trends
- Part 9 – ASIC/IC Verification Technology Adoption Trends
- Part 10 – ASIC/IC Language and Library Adoption Trends
- Part 11 – ASIC/IC Power Management Trends
- Part 12 – ASIC/IC Verification Results Trends
- Conclusion: The 2016 Wilson Research Group Functional Verification Study


Comments
Leave a Reply
You must be logged in to post a comment.
Having some trouble with your charts. The total numbers for a given year add up to over 100%. For example, for FPGA Design Languages, the number of projects in 2016 using VHDL is ~60%, Verilog is 55%, SystemVerilog is 20%, and C++ is ~15%. What gives?
The reason this sums to more than 100% is that often projects have adopted more than one language. For example, a project might have a lot of legacy code or purchased IP in VHDL, while they are currently coding in SystemVerilog. Hence, they would have selected both VHDL and SystemVerilog. BTW–if you notice on any of the charts the note ” * Multiple answers possible,” then it is possible for the final sum to be greater than 100%.
Hi Harry,
It is interesting to see that you had enough OSVVM and UVVM write-in to note it. Perhaps next time you will actually include these so we can get a measure. When you don’t include OSVVM and UVVM, you disenfranchise the VHDL community and make us less likely to participate due to the bias towards SystemVerilog – personally it has been some time since I participated just for this reason.
At OSVVM.org we have seen a significant increase in the number of participants and are now up 2000+ community members.
Best Regards,
Jim
Hi Harry,
Do you have any statistics for each region? How about percentages of which regions responded previously vs which responded now?
If you survey more of Asia in the current surveys and more of Europe in previous surveys, some of the changes and increase of SystemVerilog could simply be attributed to that.
In addition, since the numbers add up to more than 100%, how about we separate the usage of free models from FPGA vendors from what the users actually write the rest of their testbench in.
Best Regards,
Jim
Hi Jim. The makeup of the study was 34.1% North America, 28.3% Asia (China, India, etc.), 26.8% Europe (Israel added into this group), 10.2% Japan (survey performed separate from Asia group), 0.6% other. There wasn’t any statistically significant change between 2014 and 2016 makeup. Europe was slightly higher and Japan slightly lower in 2016, but again, the balance was essentially the same between 2014 and 2016.
We didn’t look specifically at free FPGA models in either 2014 and 2016. We did look at IP adoption for FPGA designs, and there was a slight increase (as you would expect). But I don’t have sufficient data to make any claims on its impact on language adoption.
The reality is that all languages are important. There are a lot of design shops with a lot of legacy code for internal IPs (which they are not going to throw away).
Best regards,
-Harry