Custom Layout Designers Need New Tools for New and Expanding Markets
By Srinivas Velivala, Mentor Graphics
New debugging capabilities in Calibre RealTime can help shrink your time-to-tapeout while still ensuring high-quality products

For a long time, digital was the darling of the semiconductor industry. But then a funny thing happened—the advent of cell phones and GPS and tablets and a zillion other new products made things like power consumption and battery life important market factors. But this new emphasis on analog and mixed-signal designs also brought new market pressure to custom designers. Now more than ever, time to market could mean the difference between so-so results and profitability. With that came the need to reduce design and verification timelines while still ensuring high-quality products.
In response to that demand, we introduced Calibre® RealTime, which provides interactive DRC feedback in a custom layout environment using the same sign-off Calibre design rule checking (DRC) deck that is used for batch Calibre DRC jobs. By enabling signoff DRC during the design process, Calibre RealTime helped designers reduce the time to tapeout. Initially, the use model was intended for debugging DRC results in standard cells and block designs. As such, we included an integrated toolbar, so layout designers could highlight and step through DRC results as per the order of the results generated, or select a specific DRC check and step through the DRC results belonging to that check.
However, layout designers continued to expand the application of Calibre RealTime to larger designs, such as partial layout of a macro, or even full-chip designs, invoking it during final DRC review before tapeout (using a combination of batch Calibre and Calibre RealTime). With this use came a desire to see a complete picture of the DRC results: how many DRC checks are violated, how many DRC results are present in each check, how many DRC results can be disregarded at this design stage, and so on. Providing this type of analysis required an expanded interface GUI to allow layout designers to debug their DRC results efficiently.
The Calibre RealTime-RVE interface has the same look and feel as the Calibre RVE™ tool, to provide custom layout designers the flexibility to analyze DRC results generated from a Calibre RealTime job and formulate an efficient strategy to debug and fix the DRC errors. The interface opens up automatically after a Calibre RealTime DRC job run (Figure 1). Designers can select a specific DRC check and highlight the specific result/s belonging to that check. Designers also get a clear description of the DRC check that has been violated. In this example, the description of the check indicates that this is a double patterning (DP) error.
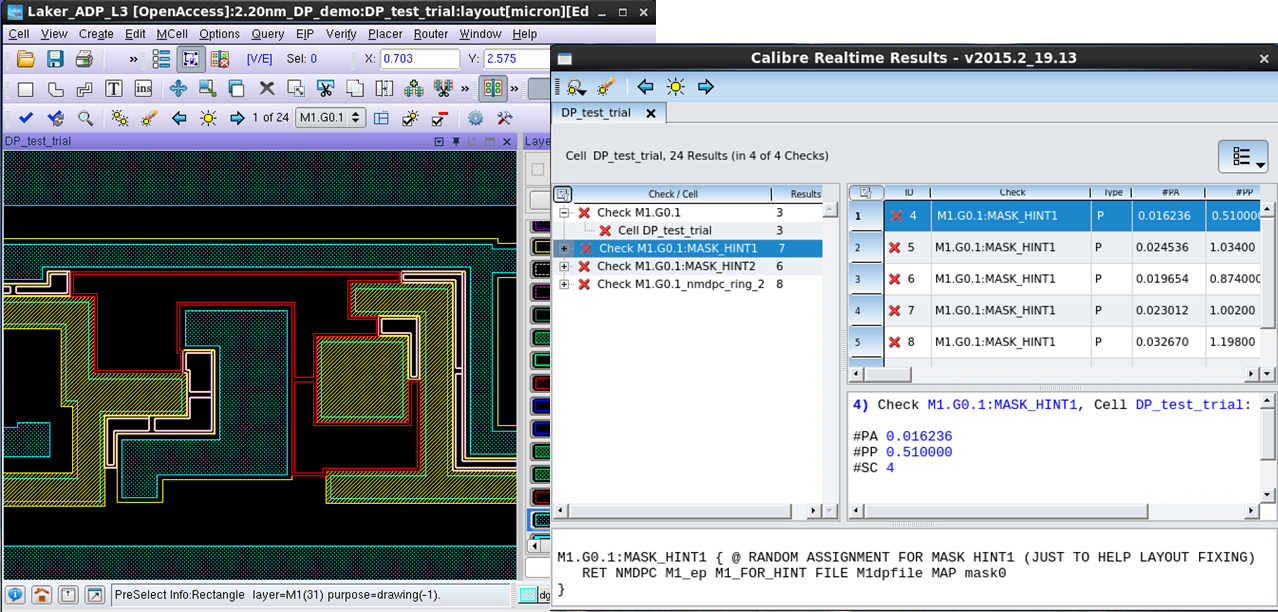
Figure 1. DRC error results in the Calibre RealTime-RVE interface.
The Calibre RealTime toolbar and Calibre RealTime-RVE interface are always synchronized (Figure 2), allowing designers to highlight DRC results from either the toolbar or the interface.

Figure 2. The Calibre RealTime toolbar and Calibre RealTime-RVE interface are always in sync.
In addition, designers can display and sort DRC results by associated characteristics, reducing visual “clutter” and allowing them to focus more efficiently on their debugging tasks (Figure 3).
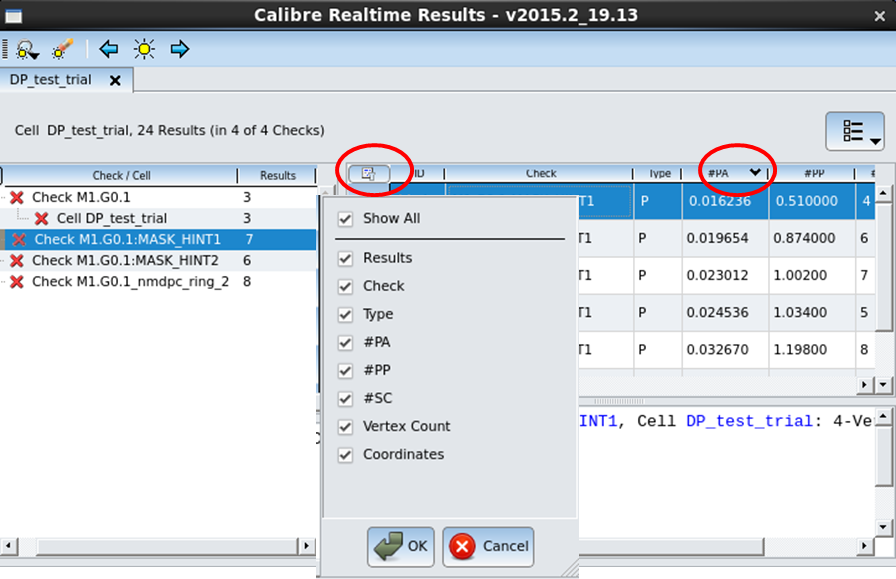
Figure 3. Custom designers can display and sort by error characteristics.
To maximize efficiency, designers can run Calibre RealTime DRC jobs on multiple designs in the layout environment, and browse all the results using the Calibre RealTime-RVE interface. The interface opens separate tabs to display the results generated from each design, preventing any mix-up or confusion, and ensuring that there is no additional delay. Designers can select any particular results tab and highlight the results from that tab. The Calibre RealTime-RVE interface automatically ensures that the DRC results are highlighted in the design window corresponding to the DRC results tab from which the highlight commands are issued.
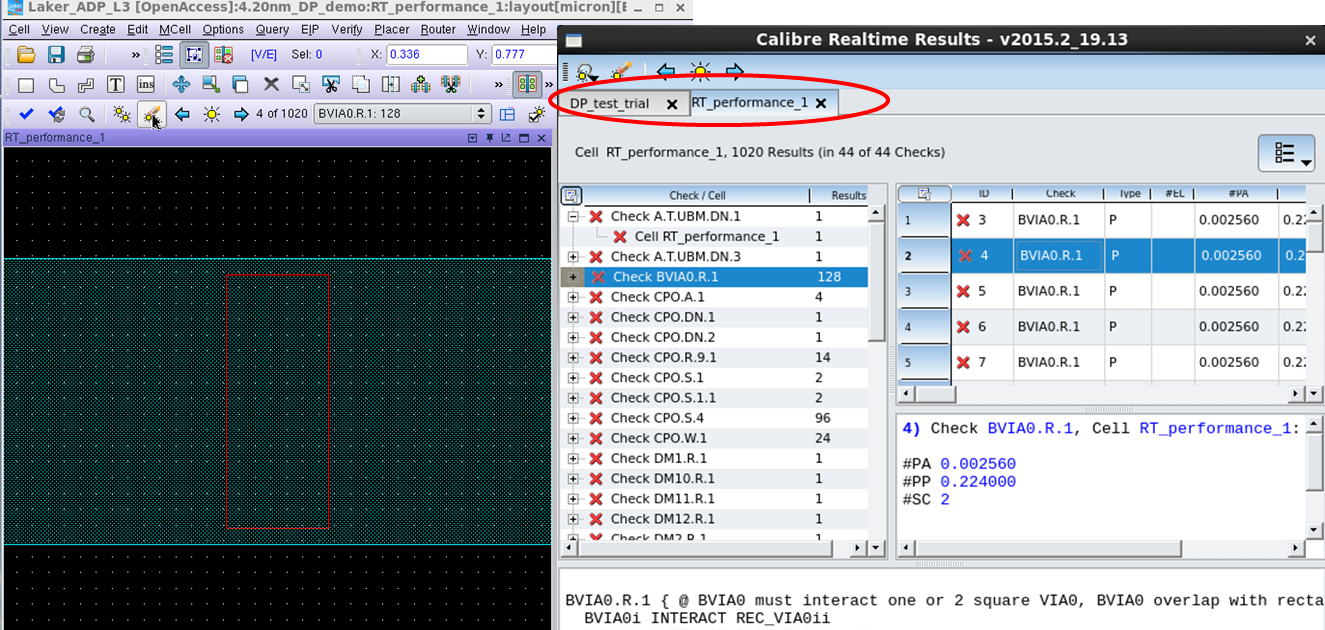
Figure 4. DRC results for multiple designs are displayed separately.
As custom layout designers use Calibre RealTime in an ever-expanding set of use models, they can be confident they will be able to easily comprehend, analyze and debug the DRC results using the Calibre-RealTime-RVE debug interface. Tools like this are essential to supporting the increasing market for custom designs while ensuring companies can produce reliable products in a timely, profitable manner.
Author
Srinivas Velivala is a Product Manager with the Design to Silicon Division of Mentor Graphics, focusing on developing Calibre integration and interface technologies.

Liked this article? How about this:
Video: How to use Calibre RealTime in the custom-design environment
Video: How to Debug Double Patterning results using Calibre RealTime