Prologue: The 2012 Wilson Research Group Functional Verification Study
This is the first in a series of blogs that presents the results from the 2012 Wilson Research Group Functional Verification Study.
Study Overview
In 2002 and 2004, Ron Collett International, Inc. conducted its well known ASIC/IC functional verification studies, which provided invaluable insight into the state of the electronic industry and its trends in design and verification. However, after the 2004 study, no other industry studies were conducted, which left a void in identifying industry trends.
To address this void, Mentor Graphics commissioned Far West Research to conduct an industry study on functional verification in the fall of 2007. Then in the fall of 2010, Mentor commissioned Wilson Research Group to conduct another functional verification study. Both of these studies were conducted as blind studies to avoid influencing the results. This means that the survey participants did not know that the study was commissioned by Mentor Graphics. In addition, to support trend analysis on the data, both studies followed the same format and questions (when possible) as the original 2002 and 2004 Collett studies.
In the fall of 2012, Mentor Graphics commissioned Wilson Research Group again to conduct a new functional verification study. This study was also a blind study and follows the same format as the Collett, Far West Research, and previous Wilson Research Group studies. The 2012 Wilson Research Group study is one of the largest functional verification studies ever conducted. The overall confidence level of the study was calculated to be 95% with a margin of error of 4.05%.
Unlike the previous Collett and Far West Research studies that were conducted only in North America, both the 2010 and 2012 Wilson Research Group studies were worldwide studies. The regions targeted were:
- North America:Canada,United States
- Europe/Israel:Finland,France,Germany,Israel,Italy,Sweden,UK
- Asia (minusIndia):China,Korea,Japan,Taiwan
- India
The survey results are compiled both globally and regionally for analysis.
Another difference between the Wilson Research Group and previous industry studies is that both of the Wilson Research Group studies also included FPGA projects. Hence for the first time, we are able to present some emerging trends in the FPGA functional verification space.
Figure 1 shows the percentage makeup of survey participants by their job description. The red bars represents the FPGA participants while the green bars represent the non-FPGA (i.e., IC/ASIC) participants.

Figure 1: Survey participants job title description
Figure 2 shows the percentage makeup of survey participants by company type. Again, the red bars represents the FPGA participants while the green bars represents the non-FPGA (i.e., IC/ASIC) participants.
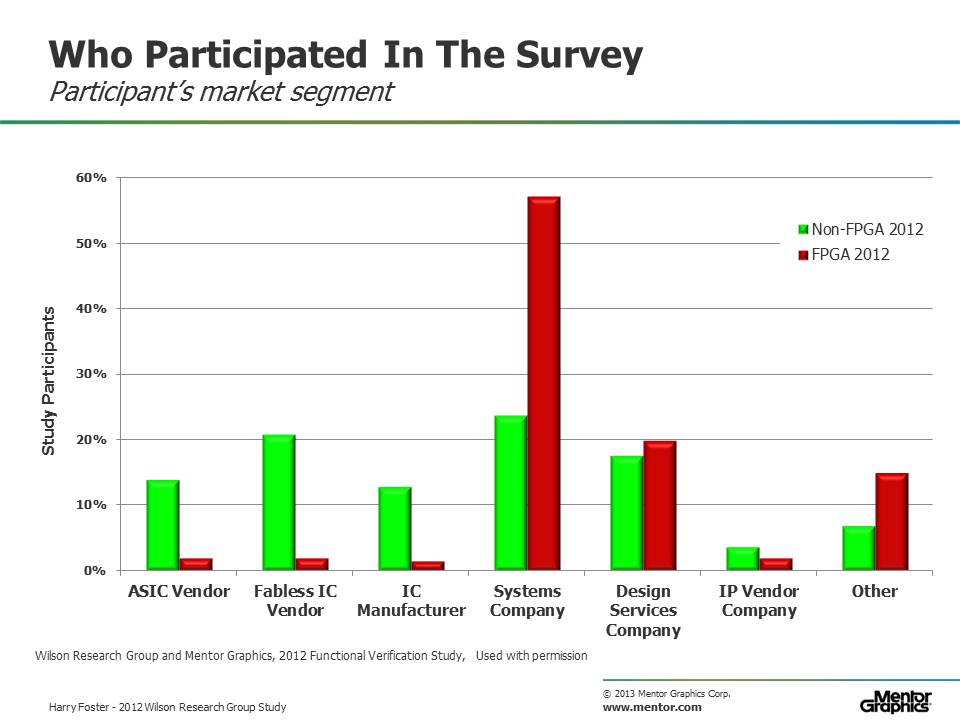
Figure 2: Survey participants company description
In a future set of blogs, over the course of the next few months, I plan to present the highlights from the 2012 Wilson Research Group study along with my analysis, comments, and obviously, opinions. A few interesting observations emerged from the study, which include:
- FPGA projects are beginning to adopt advanced verification techniques due to increased design complexity.
- The effort spent on verification is increasing.
- The industry is converging on common processes driven by maturing industry standards.
A few final comments concerning the 2012 Wilson Research Group Study. As I mentioned, the study was based on the original 2002 and 2004 Collett studies. To ensure consistency in terms of proper interpretation (or potential error related to mis-interpretation of the questions), we have avoided changing or modifying the questions over the years—with the exception of questions that relate to shrinking geometries sizes and gate counts. One other exception relates introducing a few new questions related to verification techniques that were not a major concern ten years ago (such as low-power functional verification). Ensuring consistency in the line of questioning enables us to have high confidence in the trends that emerge over the years.
Also, the method in which the study pools was created follows the same process as the original Collett studies. It is important to note that the data presented in this series of blogs does not represent trends related to silicon volume (that is, a few projects could dominate in terms of the volume of manufactured silicon and not represent the broader industry). The data in this series of blogs represents trends related to the study pool—which is a fair proxy for active design projects.
My next blog presents current design trends that were identified by the survey. This will be followed by a set of blogs focused on the functional verification results.
Also, to learn more about the 2012 Wilson Reserach Group study, view my pre-recorded Functional Verification Study web-seminar, which is located out on the Verification Academy website.
Quick links to the 2012 Wilson Research Group Study results (so far…)
- Part 1 – Design Trends
- Part 2 – Design Trends (continued)
- Part 3 – Clocking and Power
- Part 4 – Design and Verification Reuse Trends
- Part 5 – Effort Spent in Verification
- Part 6 – Effort Spent in Verification (continued)
- Part 7 – Testbench Characteristics and Simulation Strategies
- Part 8 – Language and Library Trends
- Part 9 – Language and Library Trends (continued)
- Part 10 – Verification Techniques & Technologies Adoption Trends
- Part 11 – Verification Techniques & Technologies Adoption Trends (continued)
- Part 12 – Schedules, Respins, and Bug Classification
- Epilogue


Comments
Leave a Reply
You must be logged in to post a comment.
Harry, yer killin’ me! – I have seen you present at both DVCon and DAC on verification trends in your 2012 study, but you still need to blog-it so that I can reference it in my UVM training and whenever I show companies that they should be moving to UVM. For now, I have to reference Wally Rhines’ DVCon presentation of your data: http://s3.mentor.com.s3.amazonaws.com/keynotes/DVConFeb2013_FINAL%20B.pdf (slide 14)
Get blogging, my friend!! – Cliff