Part 12: The 2022 Wilson Research Group Functional Verification Study

This blog is a continuation of a series of blogs related to the 2022 Wilson Research Group Functional Verification Study. In my previous blog I provided data related to designs that actively manage power. In this blog, I present verification results findings in terms of schedules, number of required spins, and classification of functional bugs.
IC/ASIC Verification Results Trends
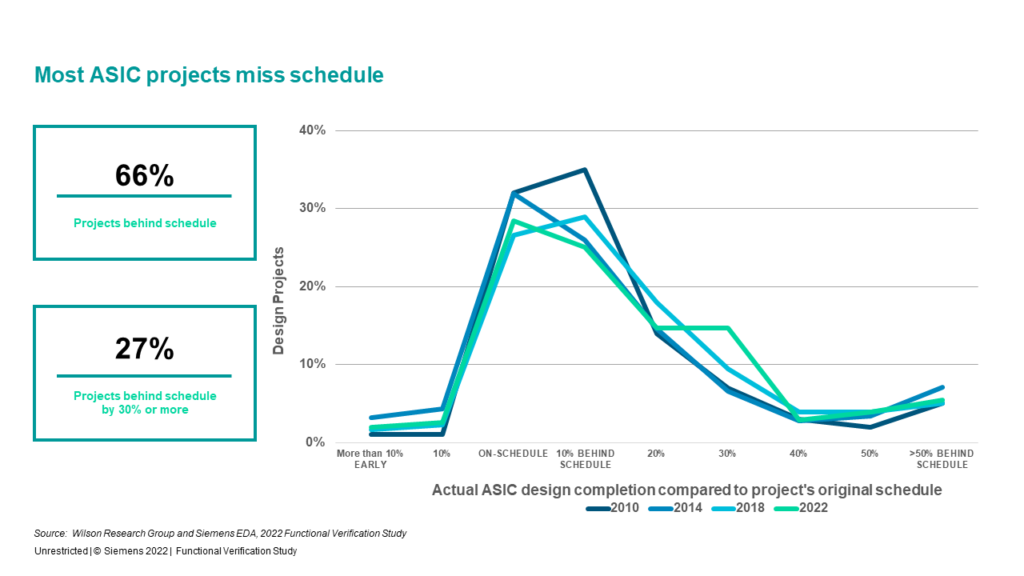
A metric often track to measure efficiency is ASIC project completion compared to the original schedule, as shown in Figure 12-1. Here we found that 66 percent of IC/ASIC projects were behind schedule, while 27% of projects were behind schedule by 27 percent.
An additional metric often track to measure effectiveness is number of spins before production. Historically, for the past 20 years, about 30% of all IC/ASIC projects were able to achieve first silicon success. However, for 2022, only about 24 percent of today’s projects can achieve first silicon success. This is the lowest required spins percentage value recorded in the past twenty years! This, combined with the increasing wafer and mask cost, has become a huge concern.
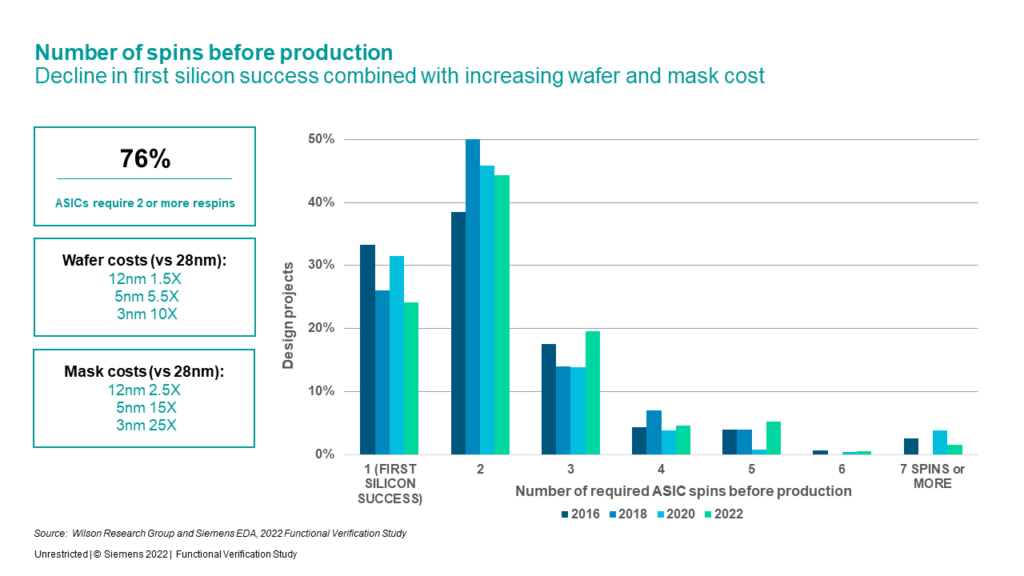
Figure 12-3 shows various categories of design flaws contributing to IC/ASIC respins, where the percentage of “logic or functional flaws” remains the leading cause of bugs. In 2020 we began tracking flaws associated with safety and security features, and the data suggest a downward trend in term of these flaws in the 2022 study. Also, for the first time, we pulled out separately yield and reliability, so we cannot show trends at this time. Finally, bviously multiple flaws can contribute to bug escapes, which is the reason the total percentage of flaws sums to more than 100 percent.
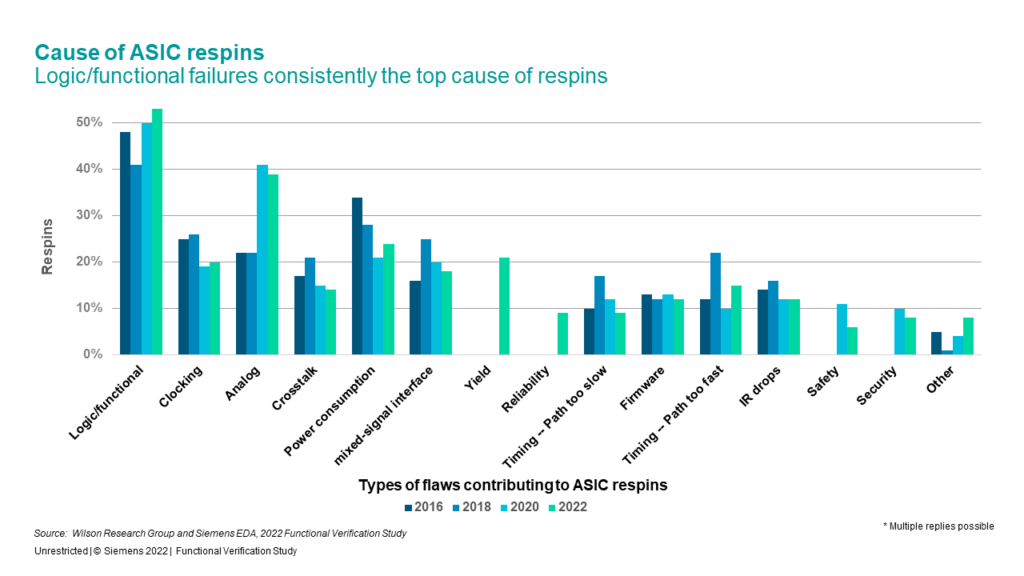
Note that in 2020 we saw a huge increase in flaws attributed to tuning analog circuits. We were curious if this was an anomaly in the 2020 study. However, the issue repeated itself in our 2022 study. I analyzed this year’s results to see whether the spike was restricted to designs at the latest technology nodes, or if it was more widespread. It turns out that while 7nm or below was the most popular answer for those experiencing the problem, it only accounted for about 16% of the cases. Almost all nodes, including 150nm and larger, were seeing these types of failures. One possibility for this is the increasing amount of analog added to IC/ASIC regardless of node size.
The next thing I looked into was whether these issues existed in only smaller designs or larger ones. The results can be seen in Figure 12-4 below. Nearly 50% of designs less than1M gates experienced respins due to analog issues. This should not be too big of a surprise since automotive and IoT are driving a large demand for smaller sensor chips that include analog. However, a significant amount of designs larger than 1M gates are also experiencing response due to analog issues!
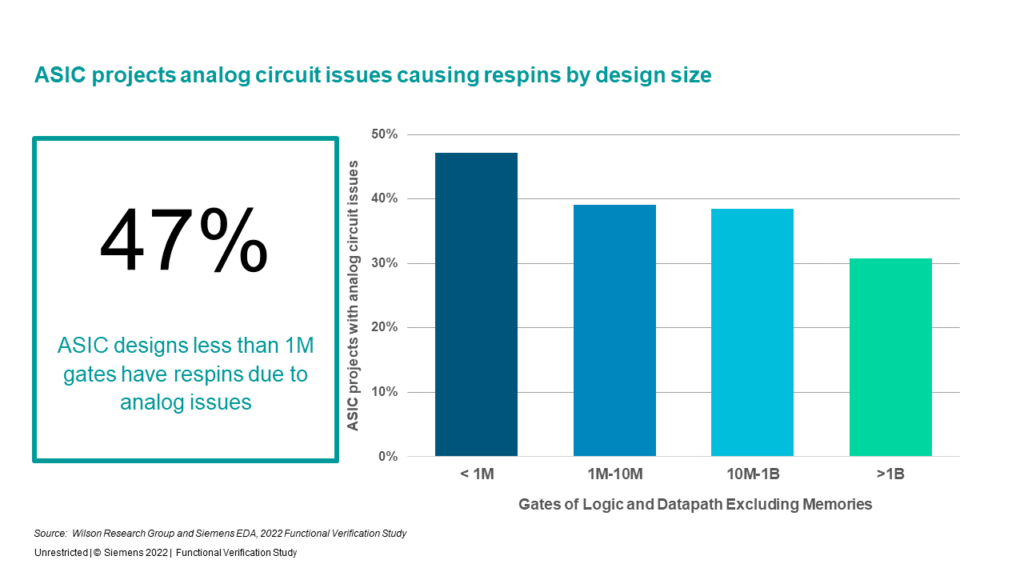
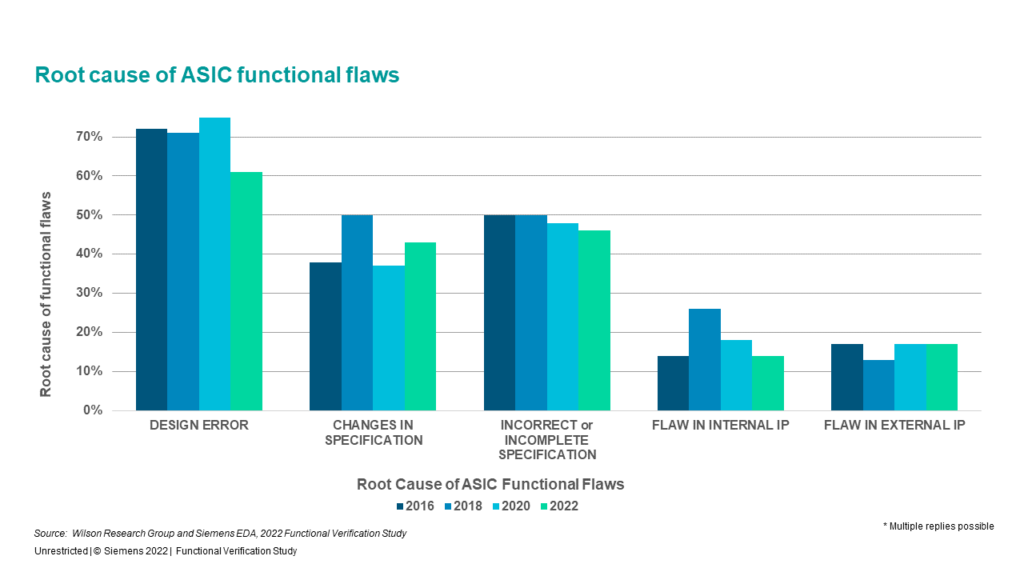
Figure 12-5 demonstrates the root cause of logical or functional flaws by various categories. The data suggest design errors are the leading cause of functional flaws, and the situation is worsening. In addition, problems associated with changing, incorrect, and incomplete specifications are a common theme often voiced by many verification engineers and project managers.
In my next blog I provide some concluding remarks and observations.
Quick links to the 2022 Wilson Research Group Study results
- Prologue: The 2022 Wilson Research Group Functional Verification Study
- Part 1 – FPGA Design Trends
- Part 2 – FPGA Verification Effectiveness Trends
- Part 3 – FPGA Verification Effort Trends
- Part 4 – FPGA Verification Effort Trends (Continued)
- Part 5 – FPGA Verification Technology Adoption Trends
- Part 6 – FPGA Verification Language and Library Adoption Trends
- Part 7 – IC/ASIC Design Trends
- Part 8 – IC/ASIC Resource Trends
- Part 9 – IC/ASIC Verification Technology Adoption Trends
- Part 10 – IC/ASIC Language and Library Adoption Trends
- Part 11 – IC/ASIC Power Management Trends
- Part 12 – IC/ASIC Verification Results Trends
- Conclusion: The 2022 Wilson Research Group Functional
- Epilogue: The 2022 Wilson Research Group Functional