Part 2: The 2022 Wilson Research Group Functional Verification Study

In my previous blog, I present FPGA design trends identified in the 2022 Wilson Research Group Functional Verification Study to illustrate growing design complexity.
In this blog, I present the findings from our new study related how successful FPGA projects are in terms of verification effectiveness.
FPGA Verification Effectiveness
Non-Trivial Bug Escapes
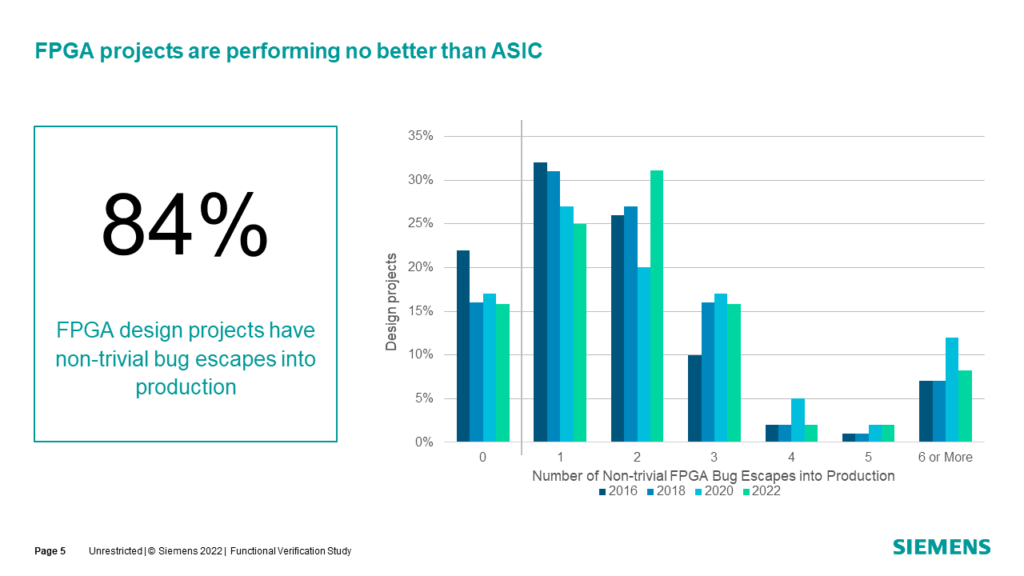
IC/ASIC projects have often used the metric “number of required spins before production” as a benchmark to assess a project’s verification effectiveness. Historically, about 30 percent of IC/ASIC projects achieve first silicon success, and most successful designs are productized on the second silicon spin. Unfortunately, FPGA projects have no equivalent metric. As an alternative to IC/ASIC spins, our study asked the FPGA participants “how many non-trivial bugs escaped into production?” The results shown in fig. 2-1 are somewhat disturbing. In 2022, only 16 percent of all FPGA projects were able to achieve no bug escapes into production, which is worse than IC/ASIC in terms of first silicon success, and for some market segments, the cost of field repair can be significant. For example, in the mil-aero market, once a cover has been removed on a system to upgrade the FPGA, the entire system needs to be revalidated.
Types of Flaws Resulting in Non-Trivial Bug Escapes
Fig. 2-2 shows various categories of design flaws contributing to FPGA non-trivial bug escapes. The percentage of “logic or functional flaws” remains the leading cause of bugs. We recently started tracking flaws are associated with safety (9 percent in 2022) and security features (9 percent in 2022). Obviously multiple flaws can contribute to bug escapes, which is the reason the total percentage of flaws sums to more than 100 percent.
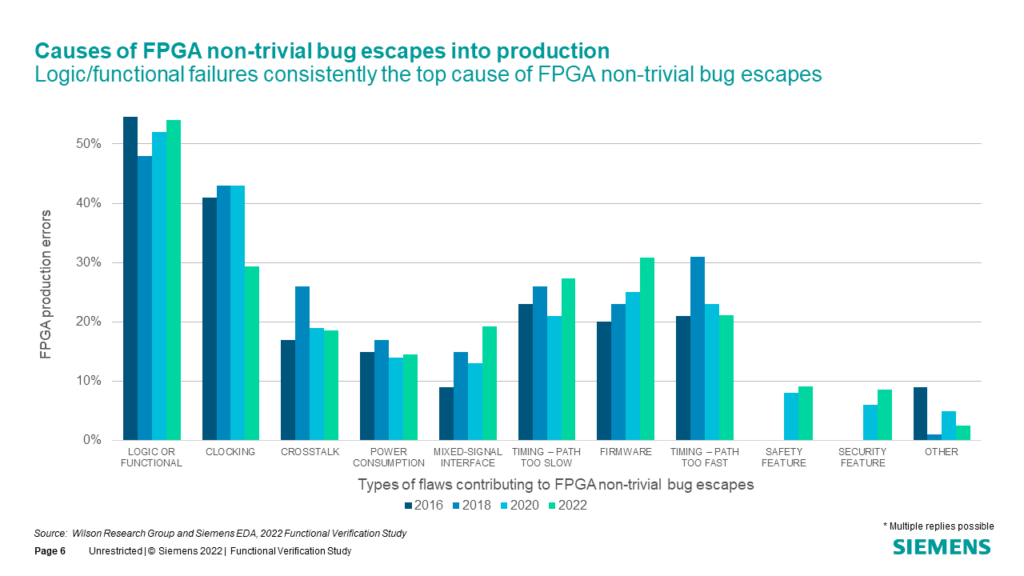
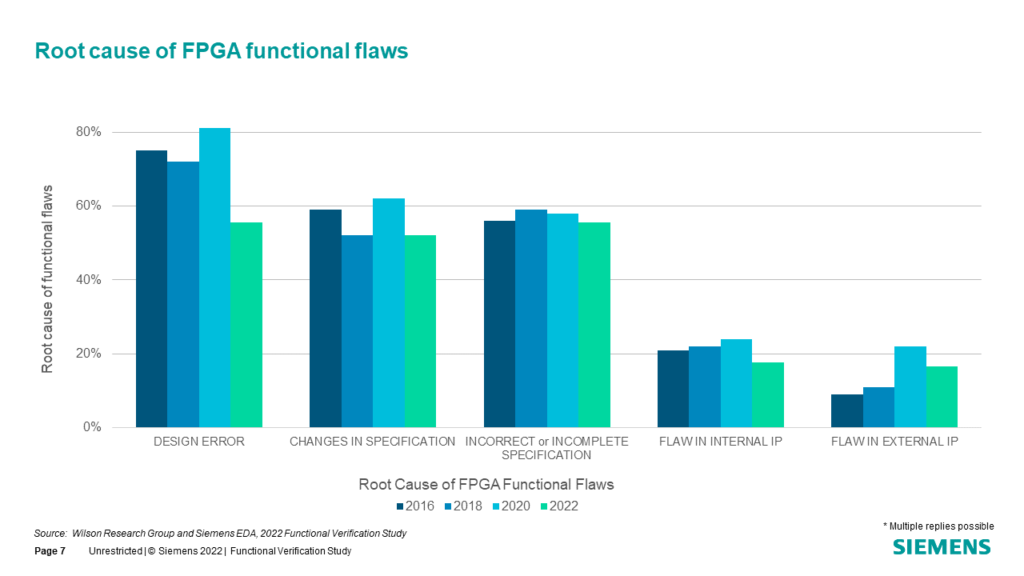
Fig. 2-3 demonstrates the root cause of logical or functional flaws by various categories. The data suggest design errors are the leading cause of functional flaws, and the situation is worsening. In addition, problems associated with changing, incorrect, and incomplete specifications are a common theme often voiced by many verification engineers and project managers.
Design Completion Compared to Original Schedule
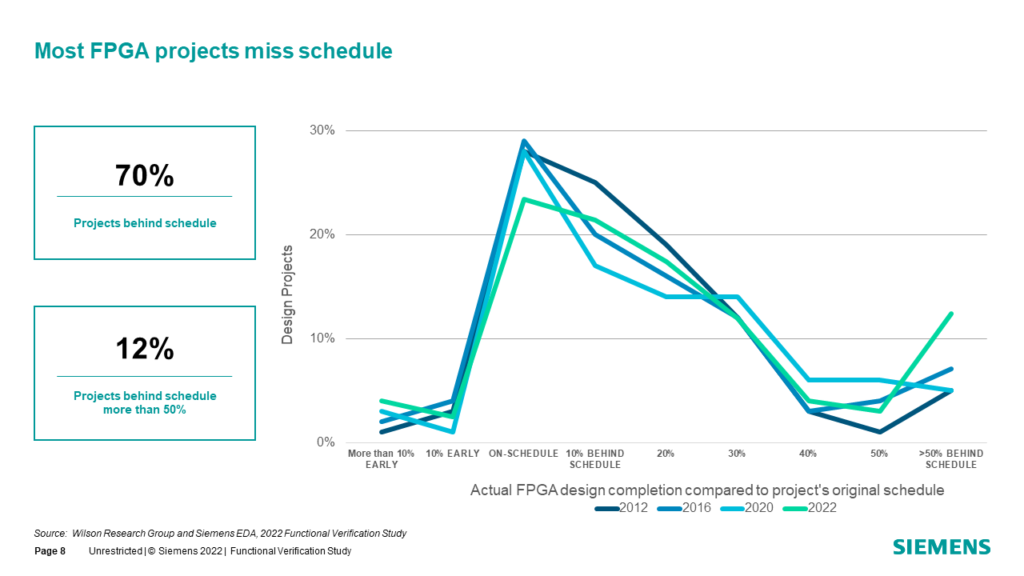
In addition to bug escape metrics that we used to determine an FPGA project’s effectiveness, another metric we tracked was project completion compared to the original schedule, as shown in fig. 2-4. Here we found that 70 percent of FPGA projects were behind schedule. One indication of growing design and verification complexity is reflected in the increasing number of FPGA projects missing schedule by more than 50 percent during the period 2012 through 2022.
In my next blog, I’ll focus on verification effort trends related to FPGA designs.
Quick links to the 2022 Wilson Research Group Study results
- Prologue: The 2022 Wilson Research Group Functional Verification Study
- Part 1 – FPGA Design Trends
- Part 2 – FPGA Verification Effectiveness Trends
- Part 3 – FPGA Verification Effort Trends
- Part 4 – FPGA Verification Effort Trends (Continued)
- Part 5 – FPGA Verification Technology Adoption Trends
- Part 6 – FPGA Verification Language and Library Adoption Trends
- Part 7 – IC/ASIC Design Trends
- Part 8 – IC/ASIC Resource Trends
- Part 9 – IC/ASIC Verification Technology Adoption Trends
- Part 10 – IC/ASIC Language and Library Adoption Trends
- Part 11 – IC/ASIC Power Management Trends
- Part 12 – IC/ASIC Verification Results Trends
- Conclusion: The 2022 Wilson Research Group Functional
- Epilogue: The 2022 Wilson Research Group Functional