Why Is My Coverage The Way It Is?
Coverage is as Coverage does
Writing coverage is an art. At least it is a skill which takes imagination, practice and patience, like I imagine sculpting or oil painting requires. Today we’ll share a little example and explore what went wrong in that little example with respect to coverage.
The example code doesn’t do anything useful – it’s just code.
I’m talking about coverage as in a fancy counter which counts occurrences of values. If the value 15 appears it gets an increment. If we define a range of 1-10, and 9 appears, then the “bin” containing 9 gets an increment.
In our example we have 5 different covergroup descriptions with 5 different coverage results. Which one is right?
Why do we count?
Usually we’re not interested in the actual count. 47 ’15’s came in versus 84 ‘9’s. We care that the count is ZERO or it is non-ZERO. So a value is “covered” if it appears and got a count. And a range (or bin) is covered if one of the included values appears. [You actually might care about something other than zero or non-zero counts, but here we don’t].
We count because we want to check that certain values (or combinations of values) appeared. If they appeared, and our circuit works properly, then we sleep better.
But what happens when we actually write the coverage collector? Bugs. Bugs happen.
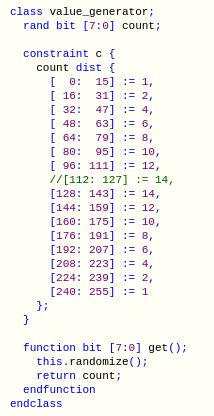
There is so much syntax. I dare you to write this included code without a reference. I couldn’t. I mean, really?
bins adjustable[] = {[0:$]};That’s quite a mouthful. Once you get the syntax working you’re off. Just make sure you collect the coverage you think you are collecting.
Some Coverage – A Coverage Collector
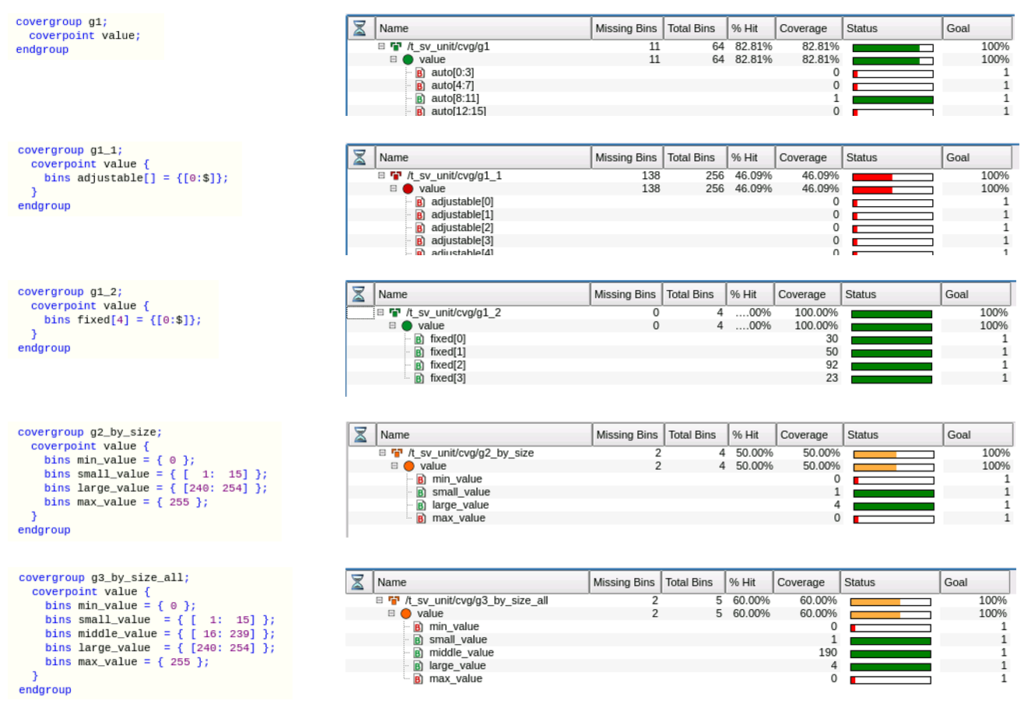
For this experiment we’ve defined a coverage collector class with an 8-bit value to be sampled. Our 8 bit value means 256 possible values. There are 5 covergroups defined. First g1 with a single coverpoint. Then g1_1 using the fancy [] notation. g1_2 uses the fixed size [4]. g2_by_size defines ranges and g3_by_size_all defines ranges that include all values.
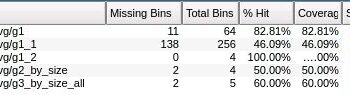
The coverage achieved “depends“. In the first coverpoint (g1), there are 64 auto_bins created with ranges of 4 each. In coverpoint g1_1, there are 256 bins created – one for each possible value. In coverpoint g1_2 there are 4 bins each with a range of 64. In coverpoint g2_by_size there are 4 bins with various ranges defined. In coverpoint g3_by_size_all, the ranges are the same, but there is an additional middle range.
Which coverage is right? It depends.
Thinking about what coverage you want to collect gets you close to the artistry of coverage. You might want the SMALLEST value and the HIGHEST value and something in the middle and perhaps some small and high values. Something like the last covergroup (g3_by_size_all).
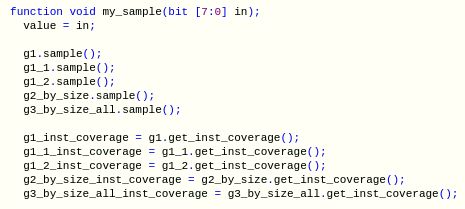
Our coverage collector class has its own ‘sample()’ routine which we call as appropriate. That sample routine is a good place for a breakpoint if you are getting “coverage you didn’t count on”. When you hit the breakpoint in the sample routine, it is easy enough to see where it is getting called.
Debugging “coverage you were counting on, but didn’t get” is harder. That’s debugging something that didn’t happen. In that case, you search for all the places that ‘sample()’ is called, and figure out why the call wasn’t made. It’s a Boolean algebra party much like figuring out why a signal did NOT go from a 1 to a 0 when you thought it should.
What about coverage over time?
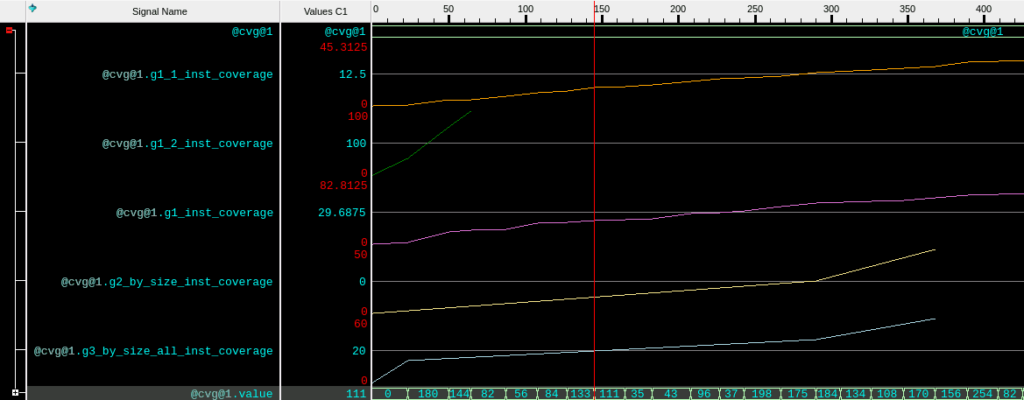
If you suspect that your coverage number climbs and gets stuck or goes up late or has other behavior over the life of the simulation, you can capture that in the wave window.
In your coverage collector, use the .get_inst_coverage() call on each interesting covergroup. Just record that real numbered value.
The g1_2_inst_coverage goes to 100% quite fast. g2_by_size_inst_coverage goes to 50% and gets stuck.
Less than 100% coverage
With less than 100% coverage, you can study your artful covergroups as above. This is the SMARTER covergroups solution.
You can simply run more simulation (with other seeds). This is the MORE values solution.
You can check your random constraints. This is the SMARTER values solution. These random values help guide the simulation. They control what happens next. Changing them can change coverage substantially. Getting them wrong can do the same.
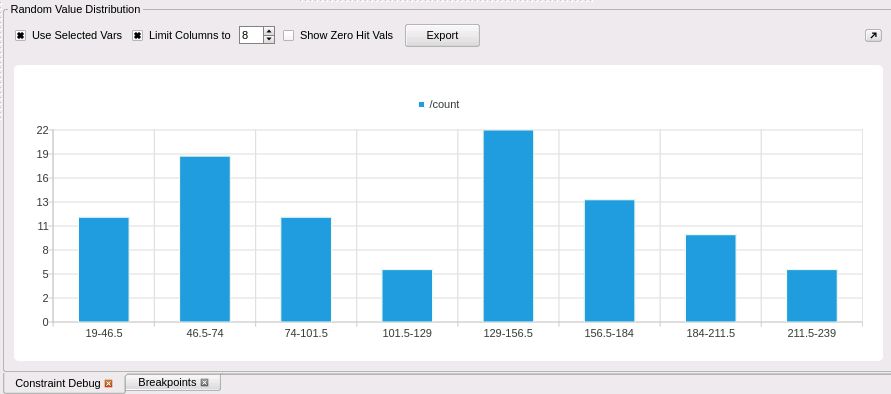
You can check the distribution you are getting from your randomization engine. Perhaps one of the cross beams has gone out askew on the treadle? (Apologies to The Spanish Inquisition [Monty Python]).
Constraint debug is a story for another day.
Thanks for reading.
How do you define and debug coverage? Are you a SMARTER covergroup person, a MORE values person or a SMARTER values person? Or just use what the VIP vendor sent?
rich
