Conclusion: The 2020 Wilson Research Group Functional Verification Study

Deeper Dive into Non-Trivial Bug Escapes
This blog is a continuation of a series of blogs related to the 2020 Wilson Research Group Functional Verification Study. In my previous blog I presented verification results findings in terms of schedules, number of required spins, and classification of functional bugs. In this blog, I conclude the series by having a little fun with some of the findings from our recent study.
For this year’s study, we decided to do a deeper dive related to the following:
- Verification maturity and non-trivial bug escapes into production, and
- Safety critical designs and silicon success.
Verification Maturity and Non-Trivial Bug Escapes
Our study results show that the IC/ASIC market has matured its verification processes overtime to address growing complexity, predominately driving by the emergence of SoC-class designs in the mid-2000 timeframe. Today we find the FPGA market is maturing its verification processes. This maturity is likely due to the growing complexity of designs and related efforts to control cost and engineering headcount through the adoption of FPGA design and verification solutions that increase productivity.
Perhaps the most concerning finding from this year’s study relates to the number of FPGA projects with non-trivial bug escapes into production. However, we did find an interesting correlation between the improvement of reduced functional flaws contributing to non-trivial bug escapes and the maturing of FPGA projects’ functional verification processes. The data suggest that projects that are more mature in their functional verification processes will likely experience fewer bug escapes.
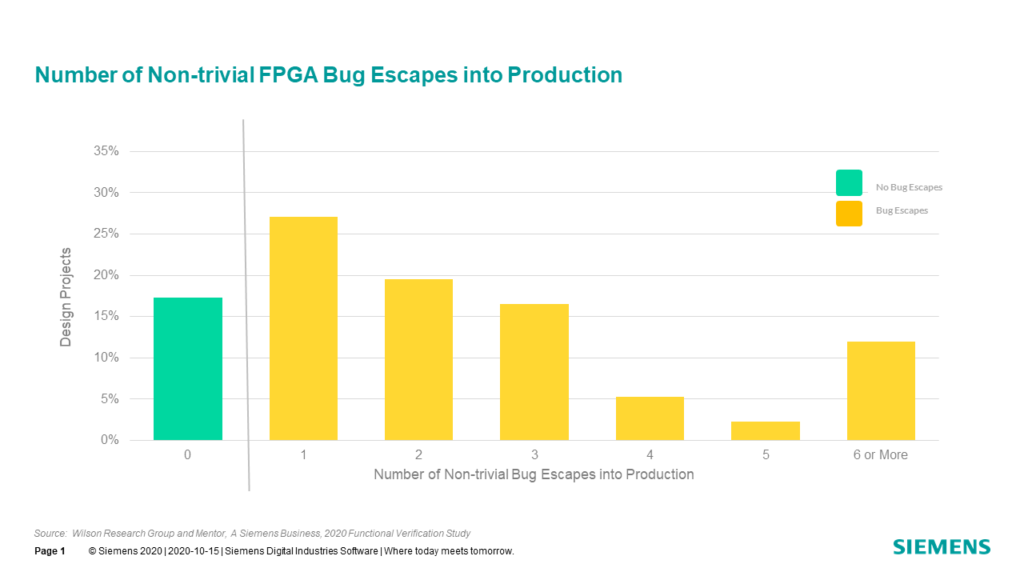
To test this claim, we partitioned the study participants into two independent groups: FPGA projects with no non-trivial bug escapes and FPGA projects that experienced a non-trivial bug escape, as shown in Fig. C-1.

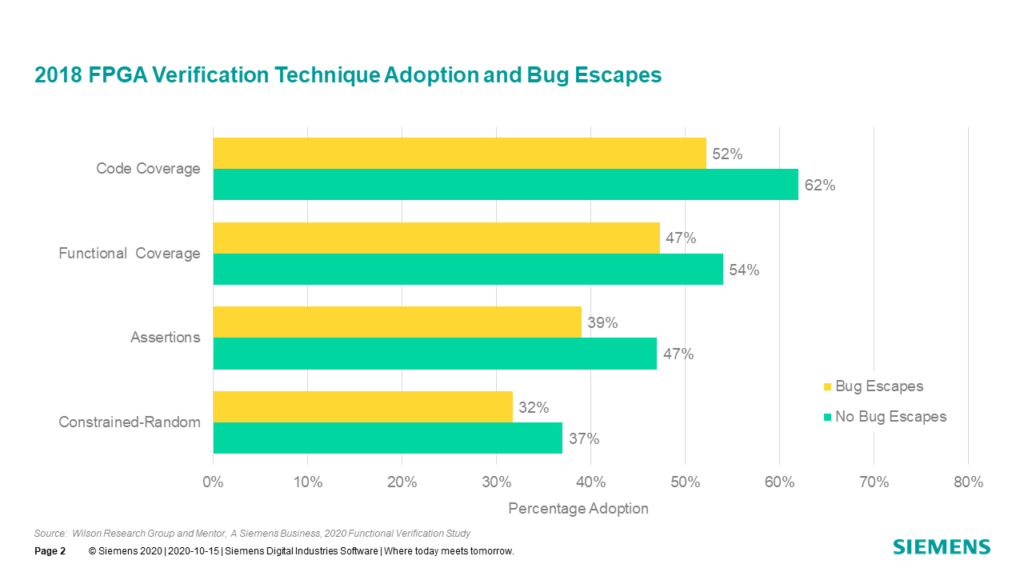
We then examined the percentage adoption of various verification techniques. The results are shown in Fig. C-2. You might note that the various verification techniques related to bug escapes and no bug escapes does not sum to 100 percent. The reason for this is that we performed our analysis in terms of technique adoption independently on the separate groups: bug escapes and no bug escapes.

These findings are statistically significant in that the group with no bug escapes tended to have higher adoption of various verification techniques, which suggest they are more mature in their verification process. However, what we are unable to measure from our study is how effective a project was in adopting any of these processes. For example, a project that experienced a bug escape could claim that they have adopted functional coverage, yet the fidelity of their functional coverage model might be poor due to their inexperience. From our study data, we are unable to assess successful or effective adoption for any particular verification technique.
Safety Critical Designs and Silicon Success
The second aspect of our 2020 study that we decided to examine a little deeper relates to safety critical designs and their silicon success. Intuitively, one might think that the rigid and structured process required to adhere to one of the safety critical development processes (such as, DO-254 for mil/aero, ISO 26262 for automotive, IEC 60601 for medical, etc.) would yield higher quality in terms of preventing bugs and achieving silicon success.
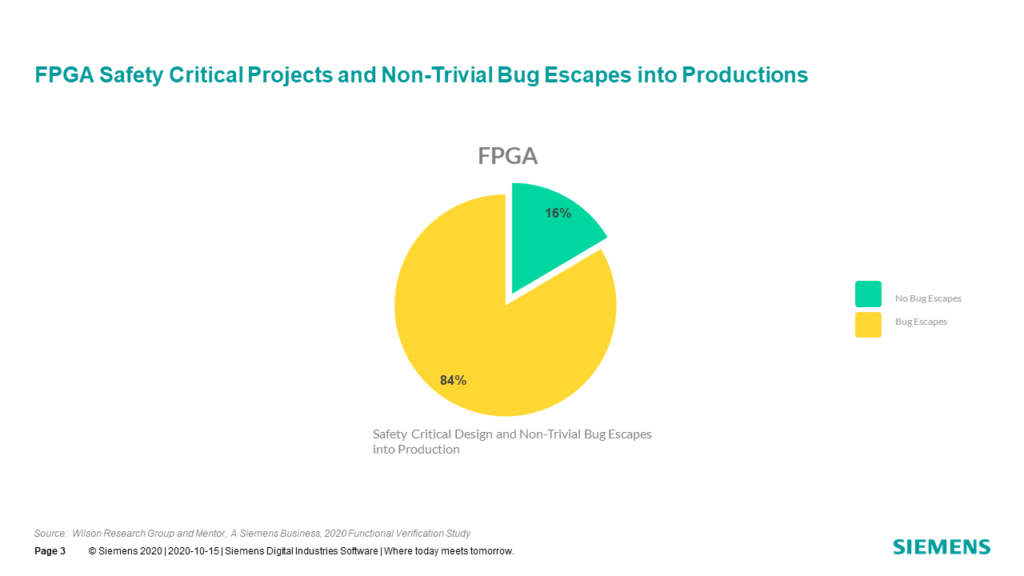
We looked at the FPGA projects working on safety critical designs, and then examined the percentage of bug escapes and no bug escapes for projects working on safety critical designs, as shown in Figure C-3.

Clearly, the data suggest that a development process adopted to ensure safety does not necessarily ensure quality. Perhaps this is non-intuitive. However, to be fair, many of the safety critical features implemented in today’s designs are quite complex and increase the verification burden.
This concludes the findings from the 2020 Wilson Research Group Study. I am planning one more blog, an Epilogue, that summarize key findings from this year’s study.
Quick links to the 2020 Wilson Research Group Study results
- Prologue: The 2020 Wilson Research Group Functional Verification Study
- Understanding and Minimizing Study Bias (2020 Study)
- Part 1 – FPGA Design Trends
- Part 2 – FPGA Verification Effectiveness Trends
- Part 3 – FPGA Verification Effort Trends
- Part 4 – FPGA Verification Effort Trends (Continued)
- Part 5 – FPGA Verification Technology Adoption Trends
- Part 6 – FPGA Verification Language and Library Adoption Trends
- Part 7 – IC/ASIC Design Trends
- Part 8 – IC/ASIC Resource Trends
- Part 9 – IC/ASIC Verification Technology Adoption Trends
- Part 10 – IC/ASIC Language and Library Adoption Trends
- Part 11 – IC/ASIC Power Management Trends
- Part 12 – IC/ASIC Verification Results Trends
- Conclusion: The 2020 Wilson Research Group Functional
- Epilogue: The 2020 Wilson Research Group Functional Verification Study


Comments