Understanding and Minimizing Study Bias (2020 Study)

This blog is a continuation on the 2020 Wilson Research Group Functional Verification Study blog series.
A big concern when architecting any type of study relates to addressing three types of bias: non-response bias, sample validity bias, and stakeholder bias. In this blog I point out where potential biases might occur in our study, and multiple techniques we adopted to minimize these biases.
Non-Response Bias
Non-response bias in a study occurs when a randomly sampled individual cannot be contacted or refuses to participate in a survey. For example, spam and unsolicited mail filters might prevent an individual from the possibility of receiving an invitation. This potentially can bias the results.
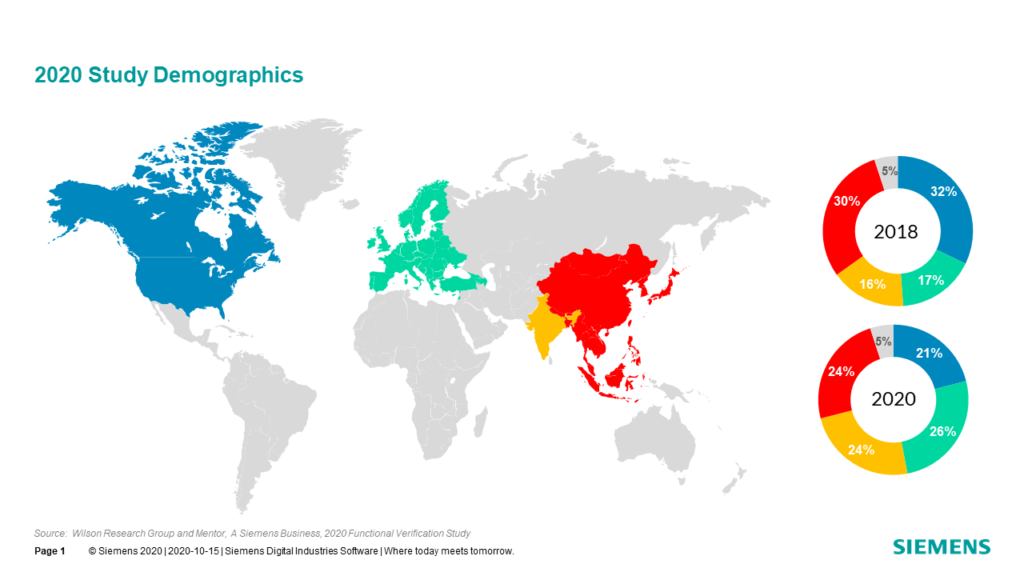
The 2020 study demographics, as shown in FIGURE 1, saw an 11 percentage points decline in participation from North America but an increase in participation from Europe and India. This raises some interesting questions. Was the decline in North American participation due to COVID-19, which was peaking in the US during the June-July timeframe, as many employees shifted their work routine to a home environment? Or were spam filters more aggressive than in previous years, preventing the invitation from reaching potential study participants?

Regardless, the shift in balance in the study demographics can introduce potential non-response biases in the findings that need to be considered. For example, regional shifts in participation can influence the findings for design and verification language adoption trends. Potential biases in the data will be highlighted in this blog series when appropriate.
Sample Validity Bias
Sample validity bias occurs when not every member of a studied population has an equal chance to participate. For example, when a technical conference surveys its participants the data might raise some interesting questions, but unfortunately, it does not represent members of the population that were unable to participate in the conference. The same bias can occur if a journal or online publication limits its surveys to only its subscribers.
A classic example of sample validity bias is the famous Literary Digest poll in the 1936 United States presidential election, where the magazine surveyed over two million people. This was a huge study for this period in time. The sampling frame of the study was chosen from the magazine’s subscriber list, phone books, and car registrations. However, the problem with this approach was that the study did not represent the actual voter population since it was a luxury to have a subscription to a magazine, or a phone, or a car during The Great Depression. As a result of this biased sample, the poll inaccurately predicted that Republican Alf Landon versus the Democrat Franklin Roosevelt would win the 1936 presidential election.
The sample frame for our study was not derived from Mentor’s customer list, since that would be a biased study. For our study, we carefully chose a broad set of independent lists that, when combined, represented all regions of the world and all electronic design market segments. We reviewed the participant results in terms of market segments to ensure no was inadvertently excluded or under-represented.
Stakeholder Bias
Stakeholder bias occurs when someone who has a vested interest in survey results can complete an online study survey multiple times and urge others to complete the survey in order to influence the results. To address this problem, a special code was generated for each study participation invitation that was sent out. The code could only be used once to fill out the survey questions, preventing someone from taking the study multiple times or sharing the invitation with someone else.
In my next blog, I begin Part 1 of the 2020 Wilson Research Group Functional Verification Study focused on FPGA design trends.
Quick links to the 2020 Wilson Research Group Study results
- Prologue: The 2020 Wilson Research Group Functional Verification Study
- Understanding and Minimizing Study Bias (2020 Study)
- Part 1 – FPGA Design Trends
- Part 2 – FPGA Verification Effectiveness Trends
- Part 3 – FPGA Verification Effort Trends
- Part 4 – FPGA Verification Effort Trends (Continued)
- Part 5 – FPGA Verification Technology Adoption Trends
- Part 6 – FPGA Verification Language and Library Adoption Trends
- Part 7 – IC/ASIC Design Trends
- Part 8 – IC/ASIC Resource Trends
- Part 9 – IC/ASIC Verification Technology Adoption Trends
- Part 10 – IC/ASIC Language and Library Adoption Trends
- Part 11 – IC/ASIC Power Management Trends
- Part 12 – IC/ASIC Verification Results Trends
- Conclusion: The 2020 Wilson Research Group Functional
- Epilogue: The 2020 Wilson Research Group Functional Verification Study


