Part 12: The 2018 Wilson Research Group Functional Verification Study
ASIC/IC Verification Results
This blog is a continuation of a series of blogs related to the 2018 Wilson Research Group Functional Verification Study (click here). In my previous blog (click here), I provided data related to designs that actively manage power. In this blog, I present verification results findings in terms of schedules, number of required spins, and classification of functional bugs.
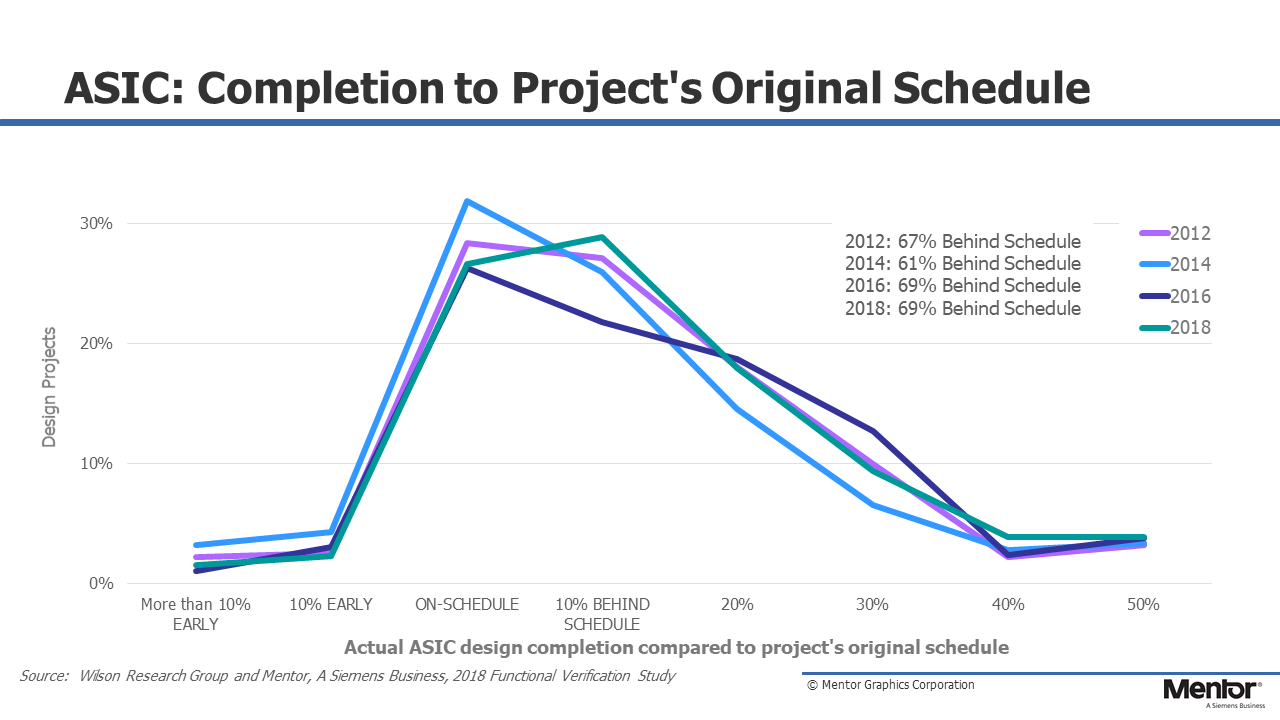 Figure 12-1. Design Completion Compared to Original Schedule
Figure 12-1 presents the design completion time compared to the project’s original schedule. While the data suggest that in 2014 there might have been a slight improvement in projects meeting their original schedule, the 2018 findings are consistent with the previous studies. The bottom line is that meeting the originally planned schedule is still a challenge for most of the industry.
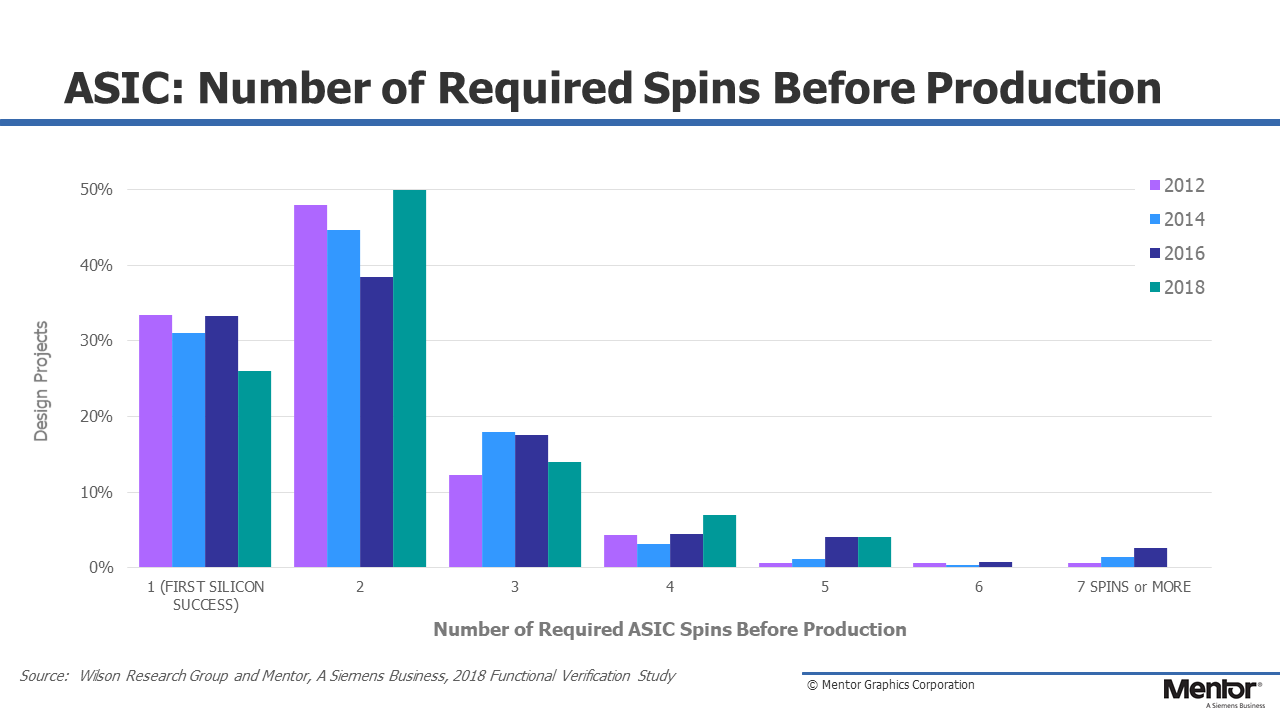 Figure 12-2. Required Number of Spins
Other results trends worth examining relate to the number of spins required between the start of a project and final production. Figure 12-2 shows this industry trend from 2012 through 2018. The data suggest that achieving first silicon success is getting worse, while achieving second silicon success has improved.
Figure 12-3 shows various categories of flaws that are contributing to respins. Again, you might note that the sum is greater than 100 percent on this graph, which is because multiple flaws can trigger a respin.
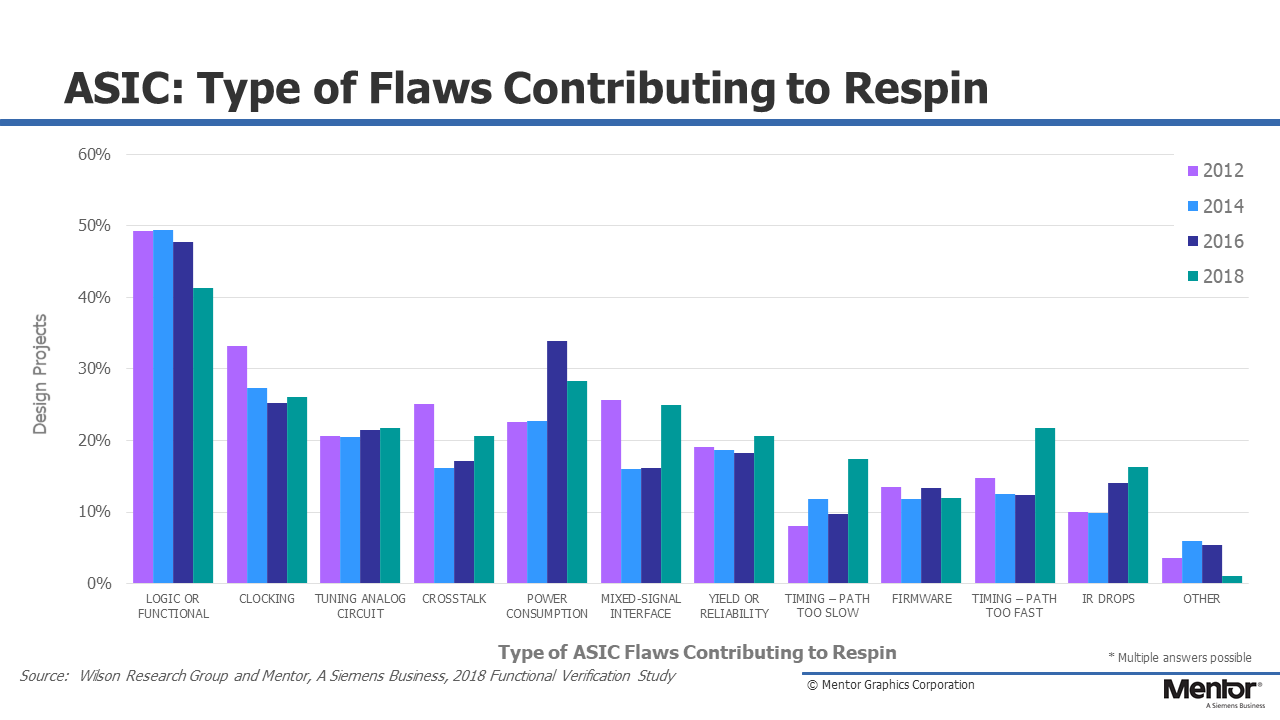 Figure 12-3. Types of Flaws Resulting in Respins
If you look at the root cause of bugs contributing to IC/ASIC respins you will note that both functional flaws and clocking flaws have improved since 2012. In other words, it is other factors shown in this graph that has led to a decrease in first silicon success, such as: fast or slow timing paths, IR drop, and mixed-signal issues.
Now there has been a common theme throughout this blog series concerning the IC/ASIC market segment. That is, for the most part, the IC/ASIC market has done a remarkable job of maturing its functional verification processes over the past 15 years. And the data in Figure 12-3 suggest that this is paying off in terms of reduced logic and functional flaws.
Figure 12-4 examines the root cause of logical or functional flaws (previously identified in Figure 12-3) by various categories. Design errors remain the leading cause of functional flaws. In addition, problems associated with changing, incorrect, and incomplete specifications are a common theme often voiced by many verification engineers and project managers.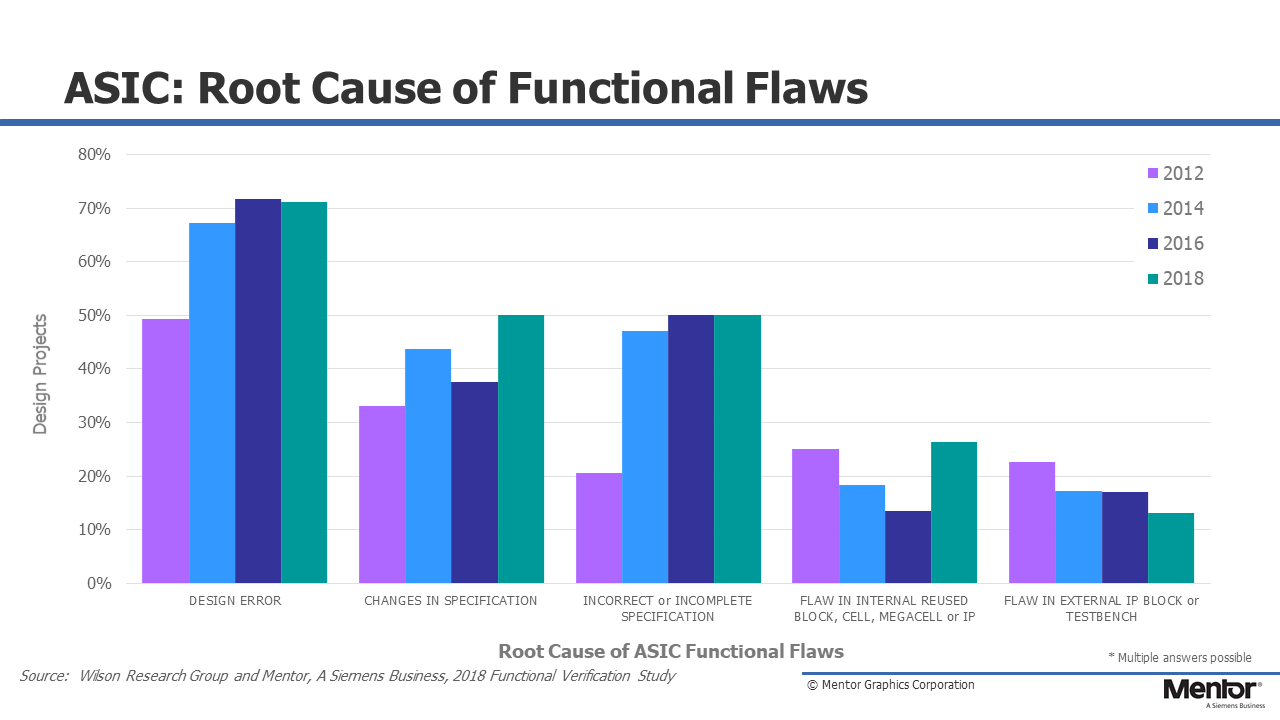 Figure 12-4. Root Cause of Functional Flaws
In my next blog (click here), I provide some concluding remarks and observations.
Quick links to the 2018 Wilson Research Group Study results
- Prologue: The 2018 Wilson Research Group Functional Verification Study
- Understanding and Minimizing Study Bias (2018 Study)
- Part 1 – FPGA Design Trends
- Part 2 – FPGA Verification Effectiveness Trends
- Part 3 – FPGA Verification Effort Trends
- Part 4 – FPGA Verification Effort Trends (Continued)
- Part 5 – FPGA Verification Technology Adoption Trends
- Part 6 – FPGA Verification Language and Library Adoption Trends
- Part 7 – IC/ASIC Design Trends
- Part 8 – IC/ASIC Resource Trends
- Part 9 – IC/ASIC Verification Technology Adoption Trends
- Part 10 – IC/ASIC Language and Library Adoption Trends
- Part 11 – IC/ASIC Power Management Trends
- Part 12 – IC/ASIC Verification Results Trends
- Conclusion: The 2018 Wilson Research Group Functional