The leverage effect: how to measure 50,000 FRFs in one day using Simcenter Testlab
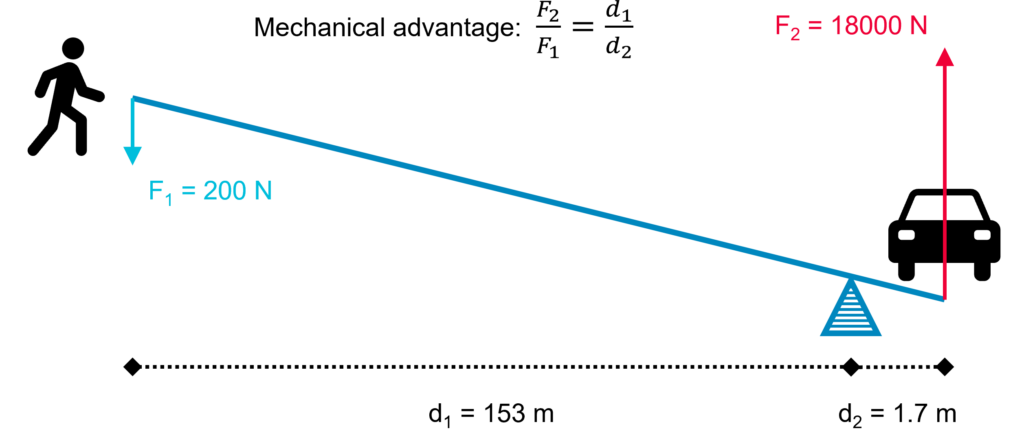
What is the simplest way to lift a car?
Unless you are Superman, just getting under the car and pushing will only lead to exhaustion and a sore back. And yet, even regular people could lift a car with just a finger and not even break a sweat!
How? The answer is, of course, to use a sufficiently large lever. Through mechanical advantage, a lever can amplify even a modest input force into a Herculean output force.
In my field of NVH testing, our day-to-day work does not involve lifting cars bare-handed. However, due to the increasing complexity of vehicle development, we are still regularly faced with equally demanding tasks.
For example, vehicle diversification and electrification put higher pressure on component integration, which increases the demand for NVH testing during development. At the same time, physical prototypes are becoming increasingly scarce to cut development time and cost, which requires more extensive testing methods to better exploit synergies between testing and simulation.
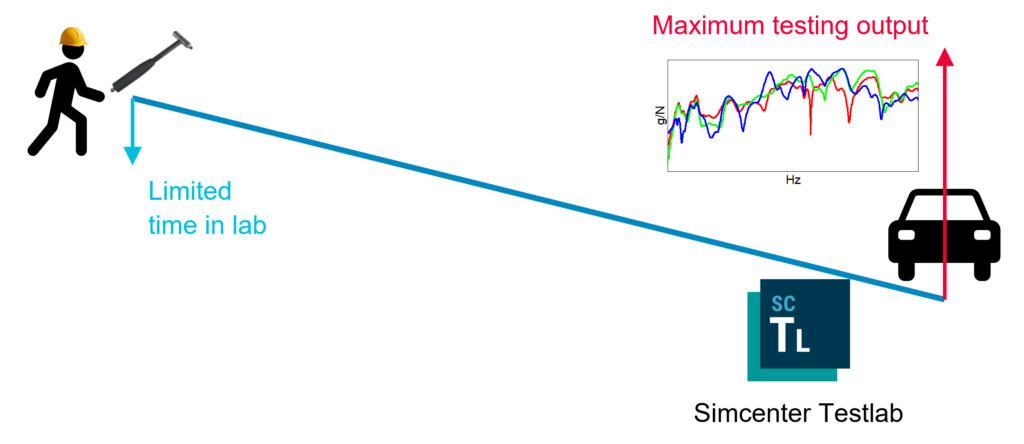
To face these challenges, NVH test engineers need tools that amplify their productivity by maximizing the output they can produce with a minimal amount of input. Just like a lever!
Story time
Let me tell you about a recent project in which I was asked to characterize a subframe for predicting structure-borne road noise using Virtual Prototype Assembly (VPA).
Before I give you the answer, can you guess how many Frequency Response Functions (FRFs) I need to measure to characterize this single component?
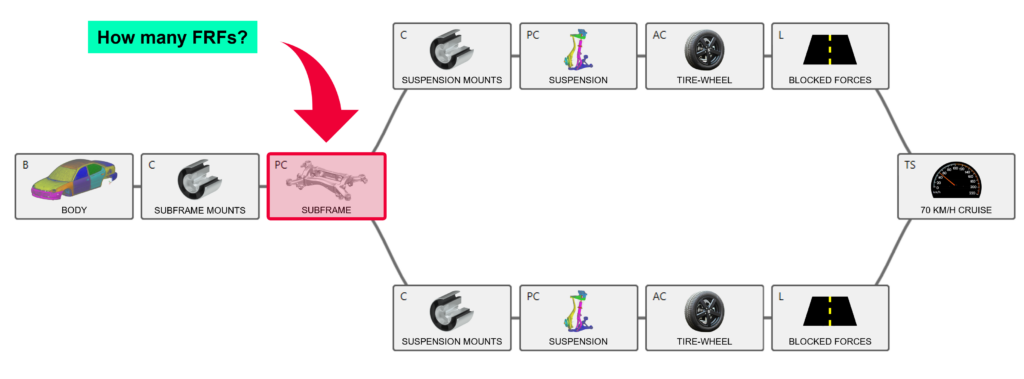
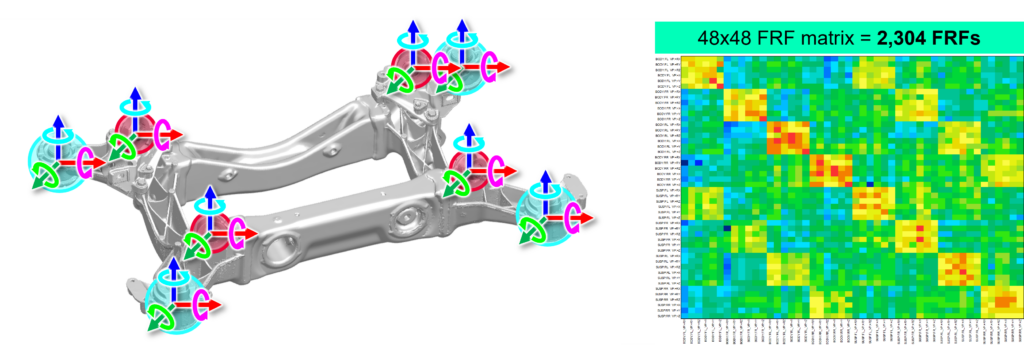
This particular subframe has 4 inputs (suspension mounts) and 4 outputs (body mounts). We need to measure 6 Degrees Of Freedom (DOFs) at each connection interface for compatibility with the simulated suspension and body models. Therefore, the subframe is characterized by a 48×48 FRF matrix between all input and output DOFs, containing a total of 2,304 FRFs.
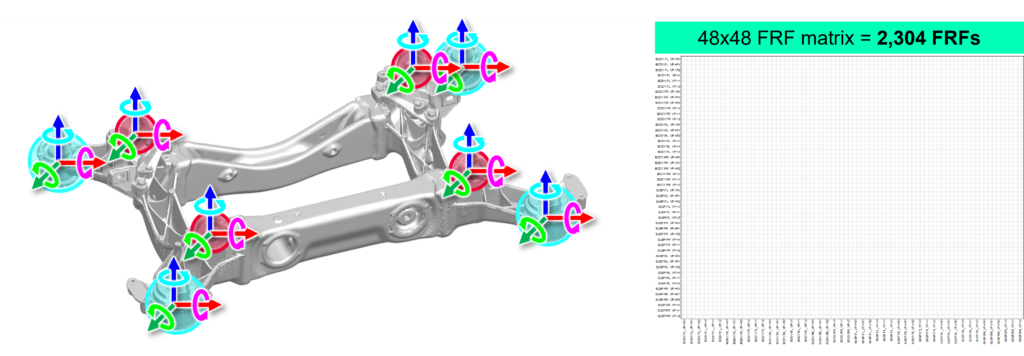
Unfortunately, obtaining these 2,304 FRFs is not straightforward. This is due to the general inaccessibility of connection interfaces, which are typically modeled as point connections at the center each mount, combined with the inability to measure rotational DOFs using traditional sensing technologies like impact hammers and accelerometers.
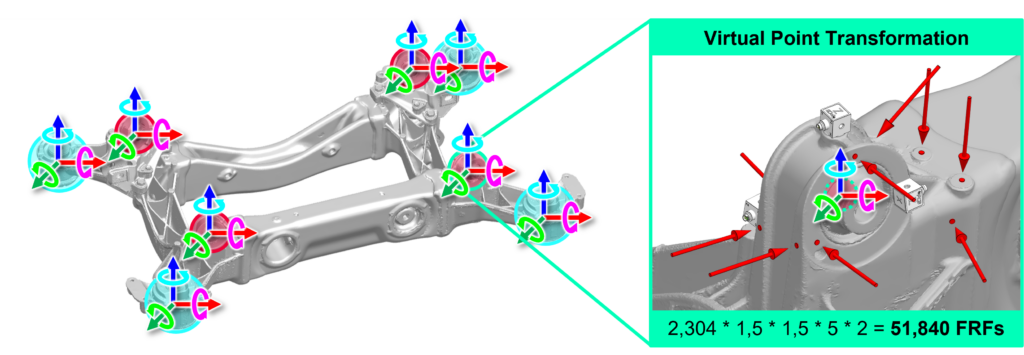
The solution is to indirectly estimate the FRFs using a technique called Virtual Point Transformation (VPT). In short, we need to measure an overdetermined set of FRFs around each mount, which are then geometrically transformed to virtual points at the center of each mount based on the assumption of local rigidity.
Assuming we will use impact testing to measure the FRFs for VPT, how does all of this affect the actual measurement effort?
The answer is: massively. VPT requires an overdetermination factor of at least 1.5 for the excitation and response DOFs. Additionally, each excitation DOF requires at least 5 impacts to average out human accuracy tolerances. Finally, the entire measurement must be repeated at least once with a second hammer tip to cover a sufficiently wide frequency range.
In summary, the actual measurement effort for this subframe is a whopping 51,840 FRFs measured over 720 impacts!
Now that we know what to do, how do we acquire this gargantuan dataset efficiently? Let me show you how I performed this measurement campaign in just one day using the new Impact Acquisition workbook released in Simcenter Testlab 2406.
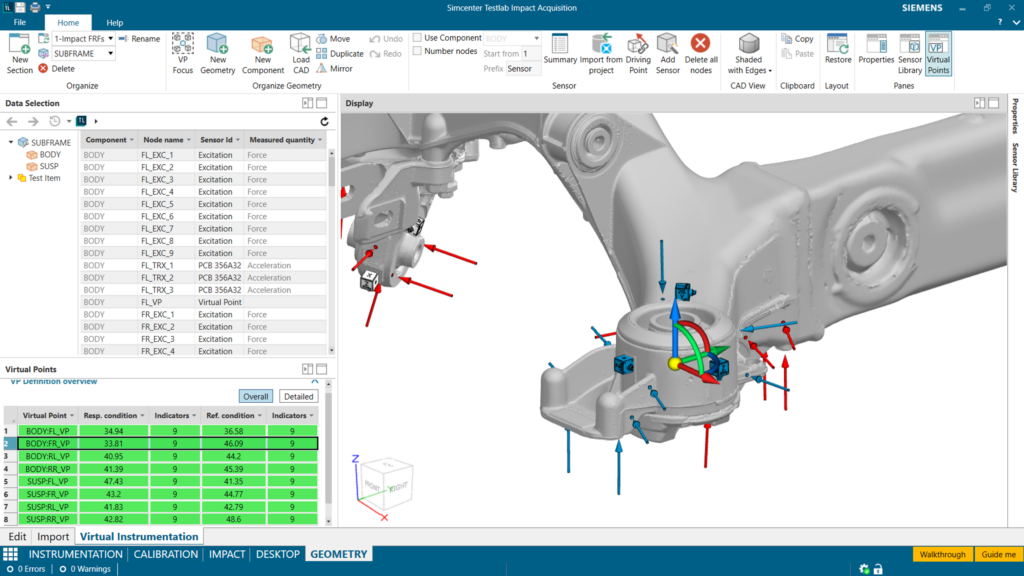
9:00 – 10:00: Virtual instrumentation
With any large measurement campaign, we want to be absolutely sure that we measure ‘first time right’. The key to achieving this is to prepare and validate the intended physical instrumentation on a virtual geometry, either from CAD or a geometry scanner.
The position of each sensor relative to the virtual points can then be extracted automatically and with high accuracy from the virtual instrumentation. This allows us to validate the expected VPT quality up-front and optimize the sensor positions where needed.
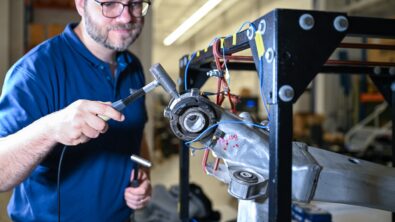
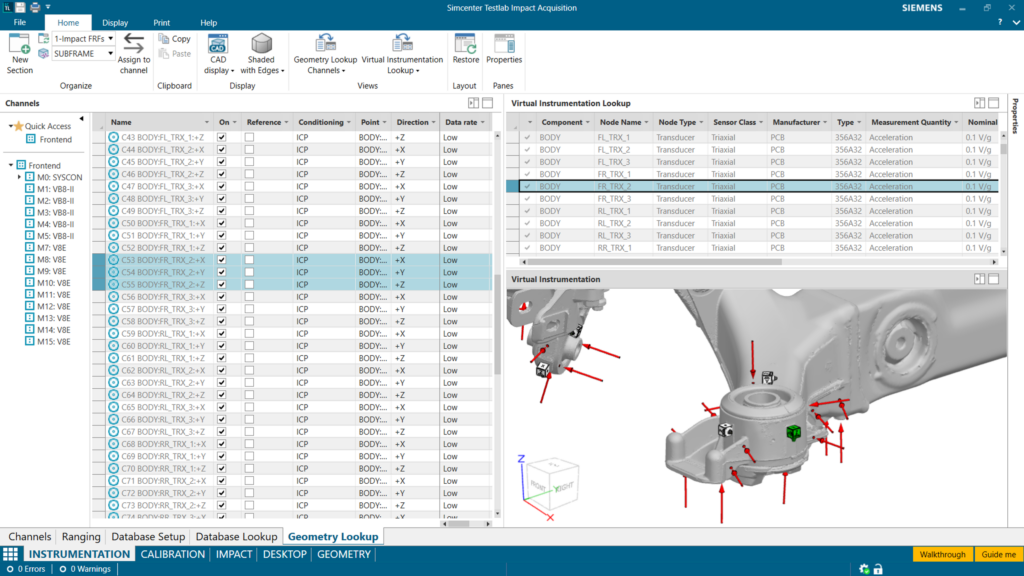
10:00 – 12:00: Physical instrumentation
Once the optimal sensor positions have been found, it’s time to physically attach them to the structure. While doing this, the virtual instrumentation serves as an incredibly valuable visual reference for correctly positioning sensors and assigning them to the channels of the data acquisition system.
12:00 – 13:00: Lunch
Let’s take a moment to mentally prepare for what comes next.
13:00 – 16:00: Impact testing
We need to measure 720 impacts over the next three hours, which is one impact every 15 seconds on average. The key to achieving this level of productivity is to prioritize the acquisition of a complete and accurate FRF dataset while in the lab, and to defer parameter fine-tuning and data clean-up to the office.
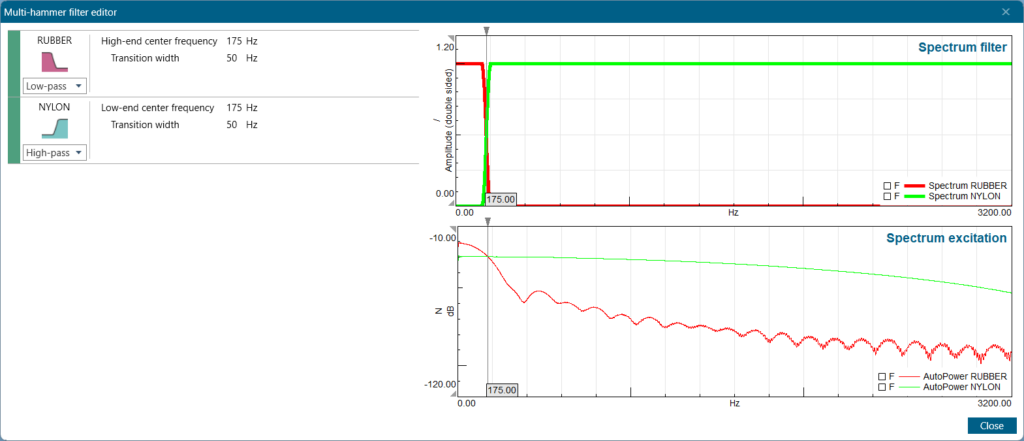
A major bottleneck is that at least two hammer tips are needed to cover a sufficiently wide frequency range, meaning that at least two excitations and a merging operation are required for each FRF. To streamline this process, Impact Acquisition supports the parallel connection and operation of multiple hammers. Each excitation will automatically be processed according to a pre-defined merging strategy based on each hammer’s input force spectrum.
Another time-saving feature is the new campaign-based workflow, which simplifies the parameter setup to just the bare essentials like the sampling frequency and frame length. Only raw time data will be stored while measuring, which means that any processing parameter can still be updated on the fly and will automatically propagate to the entire measurement campaign.
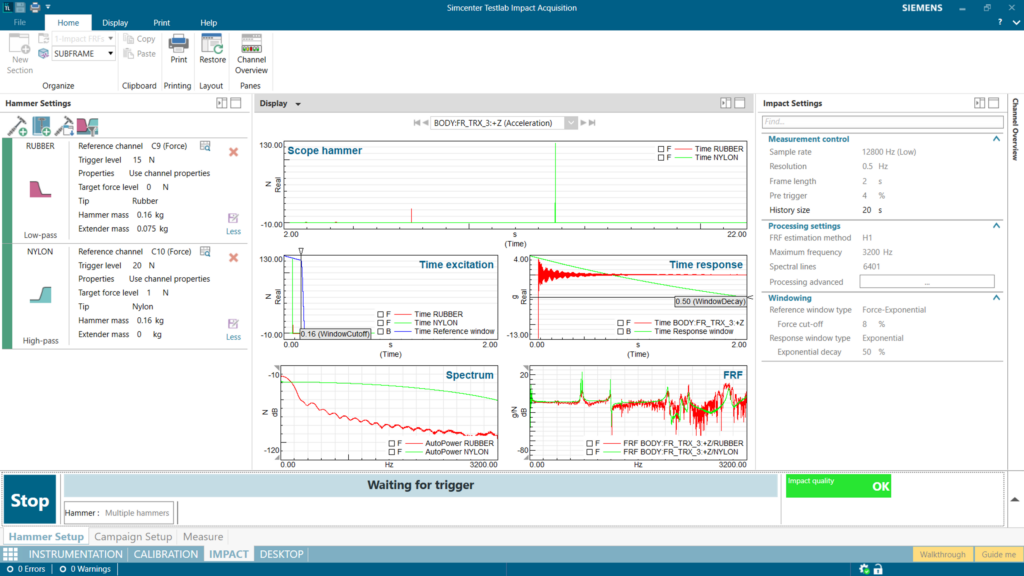
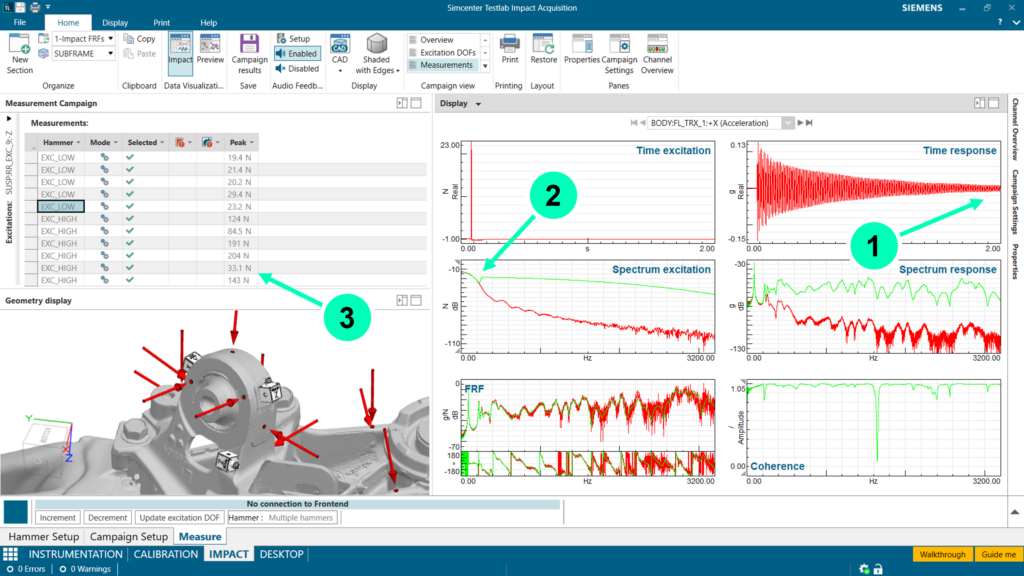
During the measurements, the (pre-defined) order of the excitations can be visually referenced on the virtual instrumentation. To avoid losing time on software interactions, Impact Acquisition will automatically detect which hammer was used for each excitation, accept or reject the measurement based on several quality checks, and apply the appropriate merging strategy to the results. Acoustic signals inform the operator about the status of each step, simplifying single-person operation away from the PC.
In summary, this workflow maximizes the quantity and accuracy of the FRFs we can measure during our time in the lab.
16:00 – 17:00: Validation & processing
Phew, we managed to acquire all 51,840 FRFs in just three hours! Now let’s move to the office to finalize our impact selection and processing parameters.
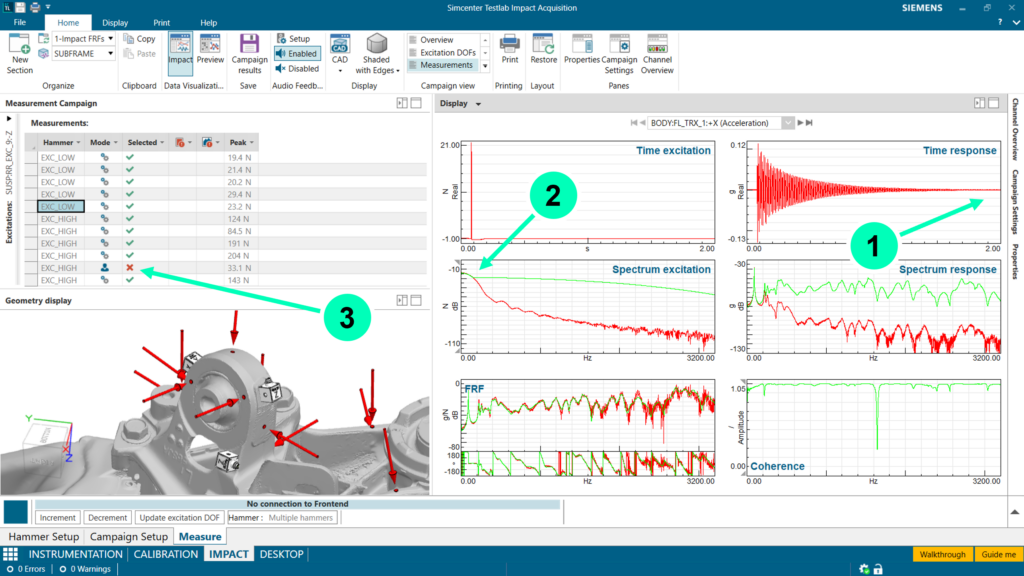
Oh dear, it looks like we made a few mistakes! First, we didn’t set up a long enough frame length for natural response decay when using the soft hammer tip. Second, the merging strategy does not provide a smooth transition between the two hammers. Third, some of the impacts show abnormally low force levels and may pollute rather than improve the results.
Thanks to the campaign-based workflow, we can still solve all three issues without redoing the entire measurement campaign. We will start by increasing the exponential window decay parameter to reduce leakage. Then, we will optimize the merging frequency based on the input force spectra per hammer. Finally, we can manually exclude any low-quality excitations that were not already detected by the automatic quality checks.
These modifications are immediately applied throughout the complete dataset. This makes it easy to iteratively fine-tune and optimize the processing parameters.
Once we are satisfied with the quality of the FRF dataset, we can process it using VPT to finally obtain the 48×48 FRF matrix which characterizes the subframe.
Now what?
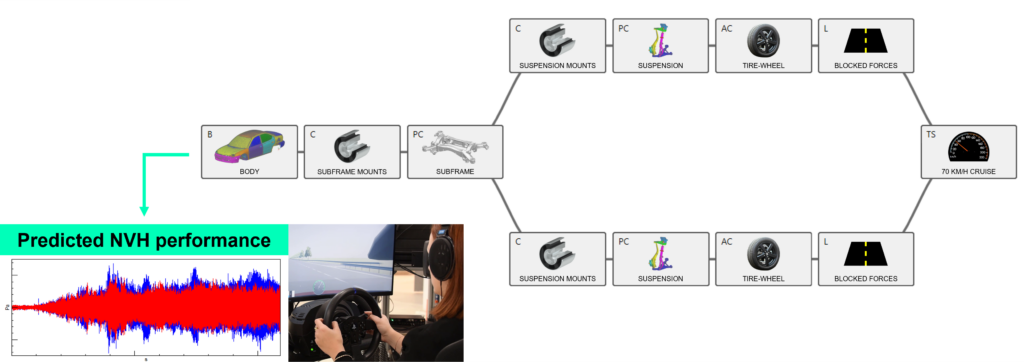
As I mentioned before, the goal of this project was to predict structure-borne road noise using Virtual Prototype Assembly (VPA) by combining the subframe FRFs with similar data for the body, suspensions, and tires.
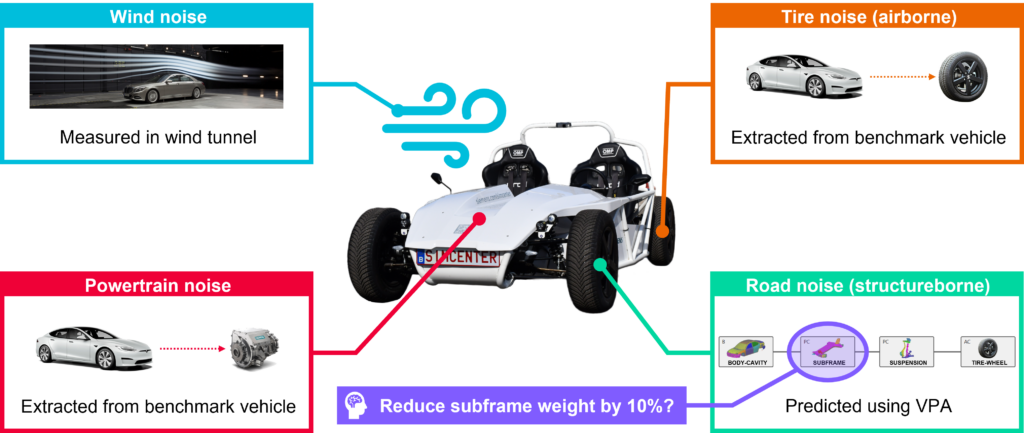
In a recent case study, we applied this methodology to evaluate the sensitivity of structure-borne road noise to virtual weight reductions at subframe-level. These prediction results could then be used to find the optimal weight reduction strategy that balances NVH with other design targets like efficiency and performance, as well as other sources such as tire, wind and powertrain noise.
Curious about the technology behind predicting NVH performance for virtual prototypes? Watch our free on-demand webinar on Component-based Transfer Path Analysis (C-TPA) to learn more. Or visit the Simcenter Community to discover what else is new in Simcenter Testlab 2406.


