Simcenter Testlab 2021.1: The power of context-driven data visualization

If you recognize the following situation, you really need to check out the rest of this blog:

“You are in a meeting to present the progress of your work. You nicely prepared your PowerPoint-slides, and all goes well, up to the moment your boss asks if he can see your results compared with the results of all the competitors, and in a different operating condition …”
Now you can count on Simcenter Testlab Desktop Neo. The Testlab Report with context-driven data visualization (Queries) enables fast comparison of the different tests/simulation iterations depending on metadata, allowing you to focus on data evaluation.
Team up with Testlab Reports
In a first step, you create your displays in Simcenter Testlab Desktop Neo. The Testlab Report entity is already present before the first display is created and of course the displays you add in the Testlab Report are the Simcenter Testlab engineering displays with embedded analytics.
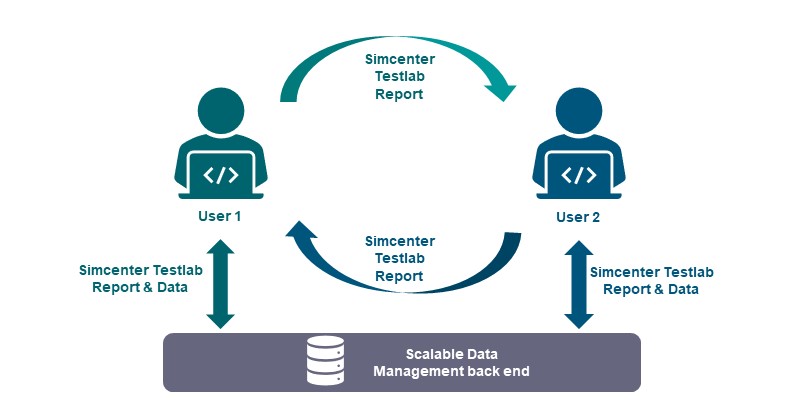
Once you dragged and dropped your data in each of the Pictures you prepared, you can save the ensemble as a Testlab Report. But when you enabled the new Query-mechanism the Testlab Report also becomes an interactive report that you can share with your colleagues, suppliers or customers.
Print to Microsoft Office
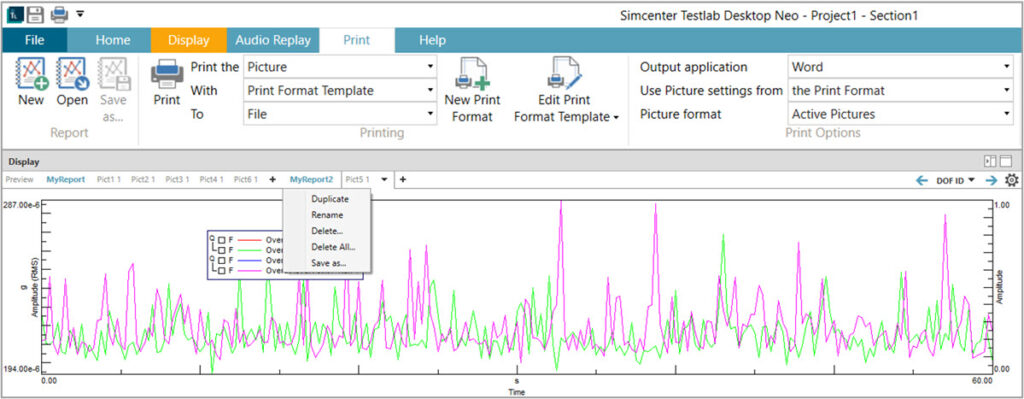
Next step: you print Testlab Report with standardized company templates to MS Office PowerPoint or Word.
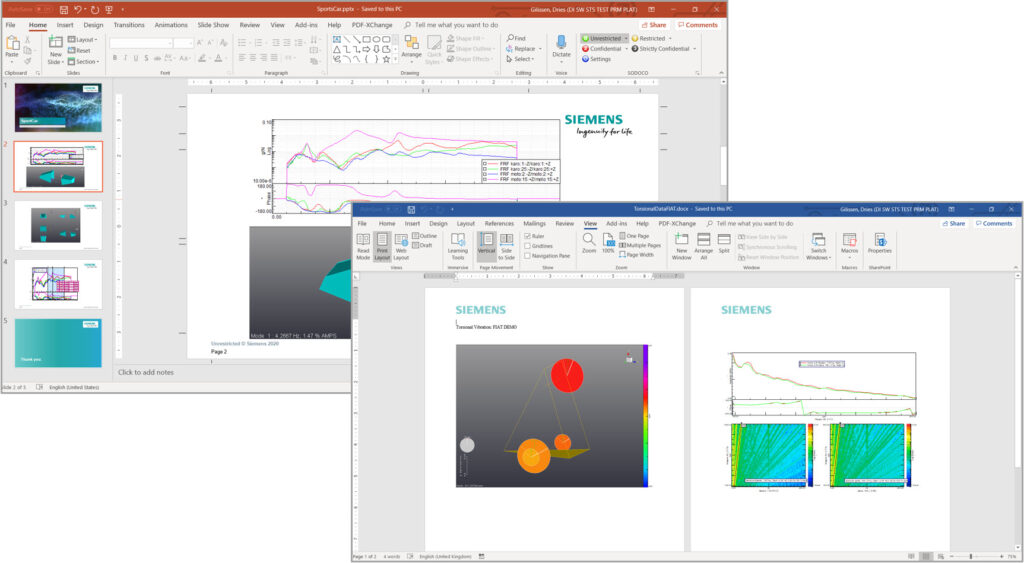
These print templates can be made in Microsoft Word software and PowerPoint presentation software. With object linking and embedding (OLE)/ActiveX technologies, your documents are not static prints, but dynamic entities so other readers can manipulate data formats and animation viewpoints to suit their requirements.
Context-driven data visualization
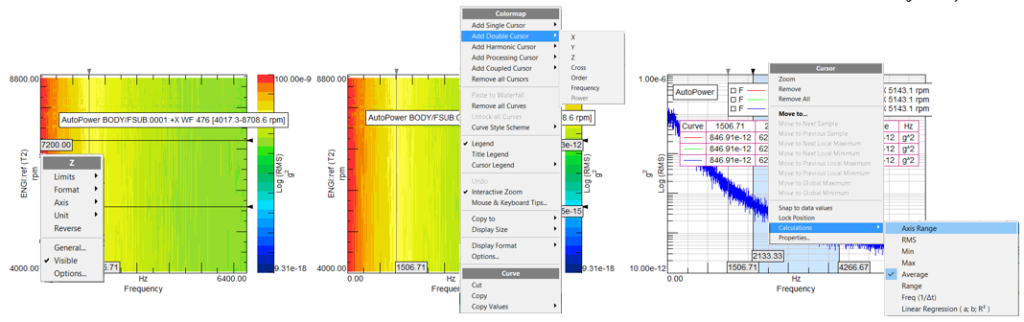
So, now you can present the progress of your work via a slideshow and use the Active Pictures, to add cursors, perform simple display processing or change in an extensive and flexible way the display settings.
However, it is at this moment that your boss suddenly pops up the question to compare your present results with the competitor’s database and change the operational condition. The first things which goes through your mind: “How to find the correct data and do I need to update each display again with the requested data?”
The answer: Context-driven data visualization!
This will be your moment of fame! You only need to open your saved Testlab Report in Simcenter Testlab Desktop Neo, if all data is saved on a shared location, you adapt the Testlab Report to your needs.

Showing the data of a different operational condition, comparing your results with the competition benchmark, adding more channels or even different functions becomes a piece of cake, thanks to context-driven data visualization.
The “Display Queries” dialog box, enables you to add, replace or remove data in a very easy and interactive way.
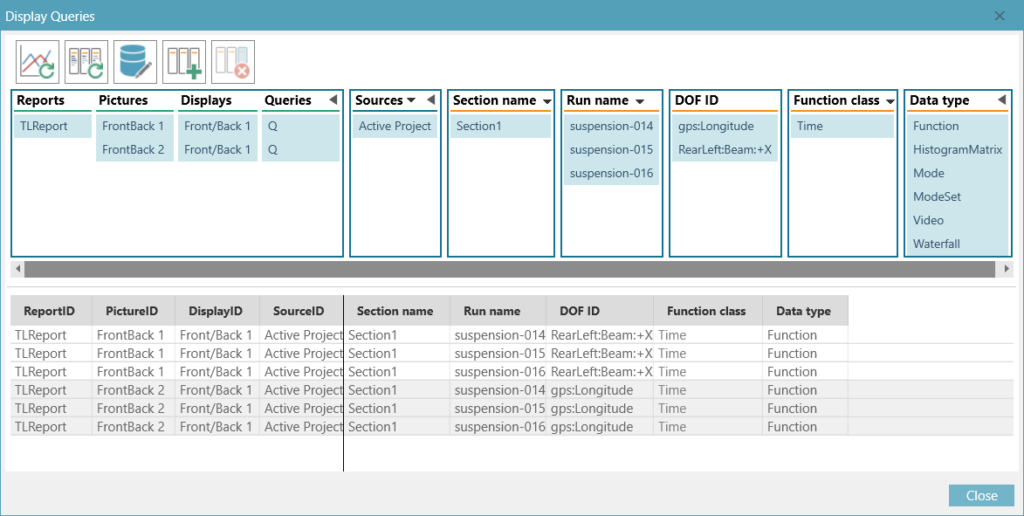
In a few mouse-clicks, you change the operational condition and add the competitor’s data to all your displays in the Testlab Report. Now you can show your boss immediately the updated pictures, or if needed, with a single click re-print the update to a new Active Report.
You want more?
Simcenter Testlab Desktop Neo is part of the Simcenter Testlab analytics and collaborations solutions. These solutions enable engineers to efficiently leverage the value of test and simulation data.
If you want to know more about these solutions right now, then check out the analytics and collaboration website.


