Simcenter Testlab 18: Testlab Adds Fatigue Life
Analyzing the durability performance of a new component is an important step for the component’s development, and Simcenter Testlab 18 has this covered. Durability performance refers to the component’s ability to function according to its requirements for an expected period of time.
Look at the picture below:
It shows a broken component. There are three visible areas on the surface where the component has been damaged. We can observe that:
- It started with a small crack (see location 1). The location of this crack depends on different parameters, which will be further explained in this article.
- When dynamic loads keep on burdening the component, the crack keeps on growing slowly. This is called the ‘crack-growing-zone’ (see location 2), which can be identified by the so-called ‘beach marks.’ We can also see that this zone is black. This is due to the heating and cooling effects on this area that are caused by material friction.
- Finally, we see the ‘Forced-fracture-zone’ (see location 3). When the crack reaches an unstable size/critical dimension, the component suddenly breaks along this forced-fracture zone.
There are two physical phenomena which lead to product failure. The first one is the ‘static strength’: a load that causes failure in one application. The loading can be monotonic, static, or steady. Static strength is not what we deal with when we refer to durability or fatigue.
The term ‘fatigue’ refers to the second phenomena: the gradual degradation and ultimate failure that occurs under loads, which vary in time and are lower than the static strength of the given metallic specimen, component or structure.
These loads are dynamic, cyclic, or unsteady in nature. The cycles are not necessarily all identical.
The main parameters determining the fatigue life of a component are:

To calculate fatigue life, there are two approaches that are common in the industry. One is the Stress Life approach; it captures the material and geometry information in S-N curves. It is the more straightforward method, but it requires the availability of S-N curves. The required S-N curves are either specific to the component under test or at least to a standard probe of the used material (material S-N curves).
The second approach is the Strain Life analysis. Here, instead of S-N curves, the material and geometry information are given by parameters. This approach can be used when no S-N curves or data specific to the component under test are available. The material properties and geometry are described in a parametric way.
With Simcenter Testlab 18.1, both Stress Life and Strain life analysis capabilities are now available in the Process Designer environment.
Process Designer offers a wide variety of methods to process load data. A workflow can focus on calculating fatigue life or combine load data processing like filtering, spike removal, drift-correction and mean stress correction with the final fatigue life calculation. This way, the complete workflow to process data — from raw measurement data via anomaly correction, to Rainflow counting, and to fatigue life calculation — can be automated in one process.
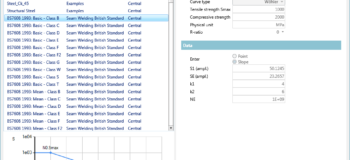
The analysis results are available in a table that displays all relevant information in a comprehensive overview:

Additionally, we can visualize fatigue results in diagrams that display, for example, design point, S-N curves and input load histogram:

Both table and diagram overviews can be used in reports and exported into Microsoft Word or Microsoft PowerPoint.
We can select the parameter settings for both Stress Life and Strain Life methods from a list, which we can edit or extend. The data is stored in Microsoft Excel files. It is also easy to import Excel files of fatigue parameter sets into Simcenter Testlab.

Simcenter Testlab fatigue analysis capabilities make it easier to get more insights from load data measurements and quickly obtain fatigue results. The Process Designer environment lets us effortlessly create workflows or efficiently use predefined processes from colleagues or company standards.
More information about Simcenter Testlab fatigue and load-data analysis is available in the attached solution brief.