Performance Map CFD – The Art of Clever Digging
“If only we knew how to do a proper Performance Map CFD!”
Engineers across the planet regularly deal with answering questions such as:
- For some operating conditions at what angle of attack will the aircraft stall?
- For all relevant rotation rates, what is the maximum back pressure that a compressor can overcome?
- At what advance ratio does my propeller efficiency become negative?
These questions almost always involve a system where acceptable performance needs to cover an envelope of operating conditions. But at the extremes things will eventually get out of hand: the flow will separate, and your airfoil can no longer generate lift.
Thorough and accurate identification of these critical points over the entire performance envelope is essential to ensuring the safe and reliable operation of the relevant systems. However, naively sweeping across a full compressor map in a Performance Map CFD, for example, does not result in the necessary information since the onset of these failure points is often very non-linear and requires very fine sampling in key areas to resolve.
Watch closely: Experienced aerodynamicist at work
Believe me, I know that pain first hand. When I was a young student and stumbled into Computational Fluid Dynamics (CFD) lectures, I had the rare opportunity to see an experienced aerodynamicist at work. While fluently teaching us the physics behind the simulation, he sketched some inlets for a radial ventilator. He set a load point and clicked the RUN button. At first, it seemed as if he just shot from the hip, but the simulation results showed us that he had hit the bull’s eye.
Later that semester, he assigned the same task to the full course. Each of us set about trying to find inlet geometries that increased the ventilator’s efficiency – over the full range of operating conditions, if possible.
No big fans of the fan
Though not big fans of this project, we dove in. We even worked night shifts trying to manually redesign the geometry. We spent hours sweeping through operating conditions trying to get things working together. We tried to compensate for our lack of experience with a brute workforce – and utterly failed. But why? Our task seemed so simple: do a Performance Map CFD of various geometries!
- Build an initial geometry
- Loop through the range of desired volume flow rates
- For any given pressure difference loop through several rotational speeds
- Hope that you do create a pressure difference, but don’t exceed your limited power requirements
Afterward, we modified our geometry and re-ran the project.
We wasted so much effort on looping through the load points to build up a decent ventilator map that we had neither the time nor the energy left for a thoughtful redesign. And while automation through macro programming seemed like it would save us the associated computational resource demands quickly exceeded those available to us. If only we could have invested those hours of self-taught java programming into actually making better designs…
Finally, we reached the deadline. We handed in something visually matching our lecturer’s design, but still failing to achieve the desired performance. At least, we got some credits for all our effort.
But my goal was set. I wanted to grow from this experience and one day have the tools and skills to defeat this challenge.
Happy Birthday, Design Manager!
Five years ago, a new feature became part of Simcenter STAR-CCM+: The Design Manager. This automation tool allows you to define and run a variety of parametric studies from within the CFD environment. This includes design of experiments, robustness, and reliability, and the ever-popular parametric design optimization. As I learned about that feature, the old ventilator inlet design project came back to my mind. I wondered how to exploit this for our Performance Map CFD. Out of curiosity, I made a brand-new attempt at this simulation project that had both impressed and overstrained me as a student. All I needed was:
- A few geometric parameters, defined in the CAD data of the inlet
- Some constraints as the upper limits of power and torque – and the lower pressure difference limit
- Volume flow across the ventilator and rotational speed to sweep through
- One fantastillion core hours of simulation time (thank you, university!)
The peak efficiency on the full “Volume flow/pressure difference” ventilator map served as the optimization criterion. Without any further brainpower, the Design Manager did its job. And one eternity later it came out with a solution quite a decent bit more advanced than my old lecturer’s inlet. And more!
On the way to its final result, there were several interesting designs that might have proven worthy for other load points as well. It turns out that brute force can compensate for lack of experience – if you take a systematic design approach and deploy vast amounts of simulation power in a parametric Performance Map CFD.
Only dig where the gold is!
Well, 5 years after it first arrived on the scene Design Manager can significantly reduce the computing power required for this exercise with the new Smart Sweep feature, as part of Simcenter STAR-CCM+ 2206. The idea behind it is very simple – it is hard to tell where the gold is before you dig the hole.
What do I mean by this?
In the traditional, rather naive, way of sweeping operating conditions, the computational time required for a Performance Map CFD would be positively outrageous when applied to the entire compressor performance map or aircraft flight envelope. What we need is a process to finely sample only in the immediate vicinity of the critical points, hence the mantra: “only dig where the gold is”. The new Smart Sweep study type in Design Manager applies coarse sampling, appropriate to the larger design space until it detects the onset of one of these critical points. Then it efficiently refines the sweep by bisecting until it identifies the onset of the phenomena in question. For that purpose, it uses a sweep interval bisecting algorithm – thus reducing the amount of both engineering and computational resources required.
Mapping under pressure
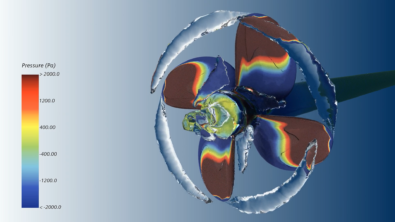
When you sweep across a compressor design, you vary the mass flow across it and its rotational speed. Primary result is your pressure ratio, and another one is your efficiency. As you reduce your mass flow at a given rotational speed, your pressure ratio is rising.
You can be sure: at one point the compressor will start to stall and of course, all your pretty pressure is lost. This eventually leads to surge, which can cause mechanical damage on the blades – but when?
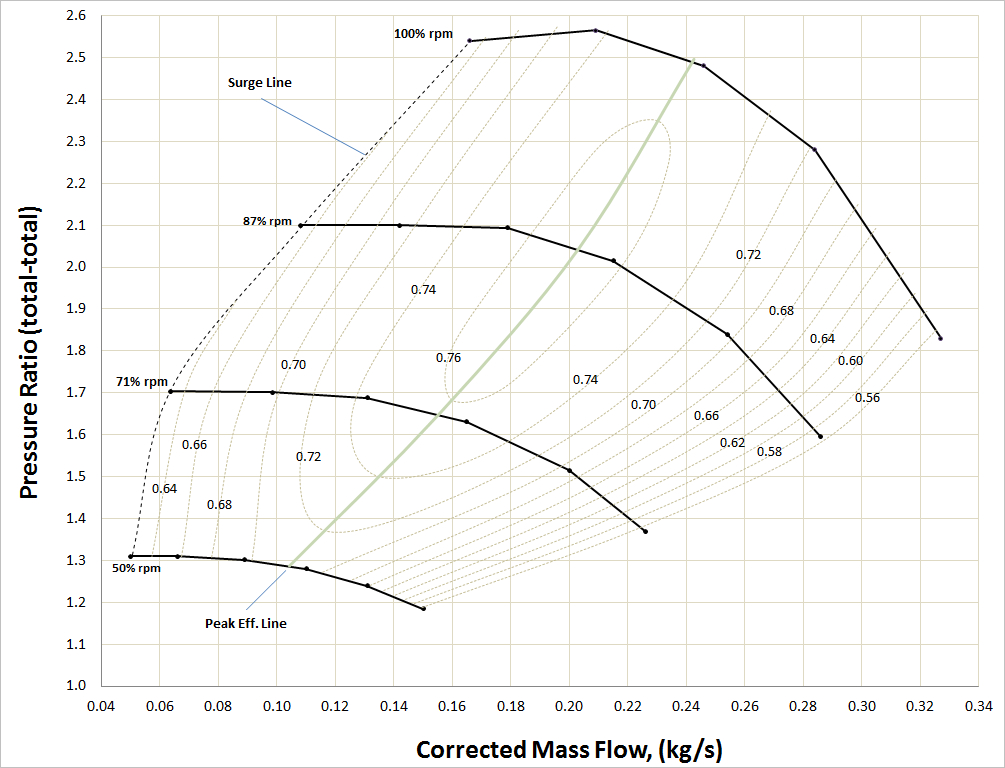
If you tell the Design Manager to sweep across the volume flows for every rotational speed using a too coarse increment, you might just miss the point when stall starts to kick in. Or with too fine increments, all the precious computation resources are wasted on the fine resolution of the speedline at the non-interesting part of the curve.
The sweet spot
The Smart Sweep feature in Design Manager facilitates the generation of compressor characteristics and Performance Map, with the objective to accurately predict the onset of stall (for example during a steady-state analysis using mixing planes). It automatically achieves this goal regardless of the chosen increment size in back pressure or mass flow (or in certain cases in exit corrected mass flow boundary condition).
This dramatically reduces the computational cost of generating a complete compressor map, especially in the context of running design space exploration, and where speed matters.
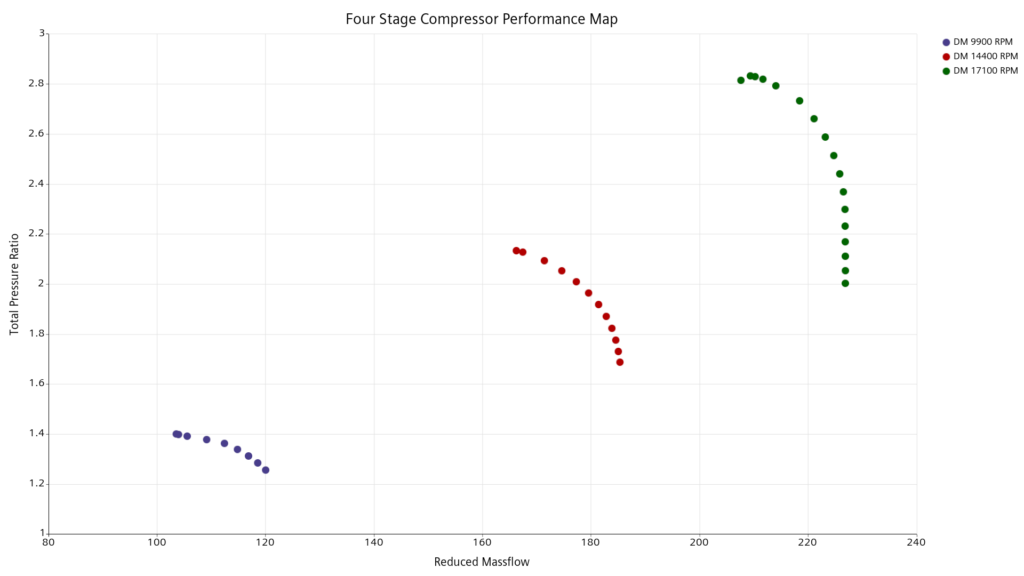
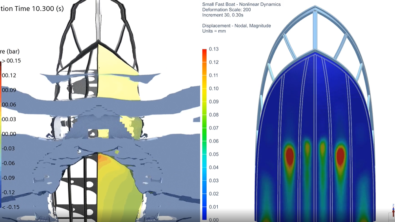
You would like to make design decision based on multiple optimization runs overnight, not in weeks. The compressor Performance Map CFD use case demonstrated here features a multi-stage axial compressor approaching numerical stall. Each simulation point reuses previous one as the pressure ratio goes up, so you don’t start from scratch. This leads to better convergence, less simulation time, and you get a more precise assessment of the surge margin.
Stop digging when all the gold is unearthed!
Self-propulsion simulations can be significantly sped up by implementing the body-force propeller method with virtual disks. The disk requires an open water propeller curve as input in leu of the geometry. It is often difficult to obtain these curves from the supplier, so a proposed way to do this is to use Design Manager to run a sweep of an open water propeller template.
The open water propeller curve provides thrust coefficient, torque coefficient, and efficiency as functions of advance ratio. Different propellers will have their efficiency go to zero at different advance ratios depending on their geometric features. The virtual disks highly depend on a complete set of curves from advance ratio from zero to the efficiency neutral point. Since it is impossible to know a priori where the efficiency will be zero, a Performance Map CFD previously needed to run over an excessively large range of advance ratios. This meant running numerous simulations that were unnecessary.
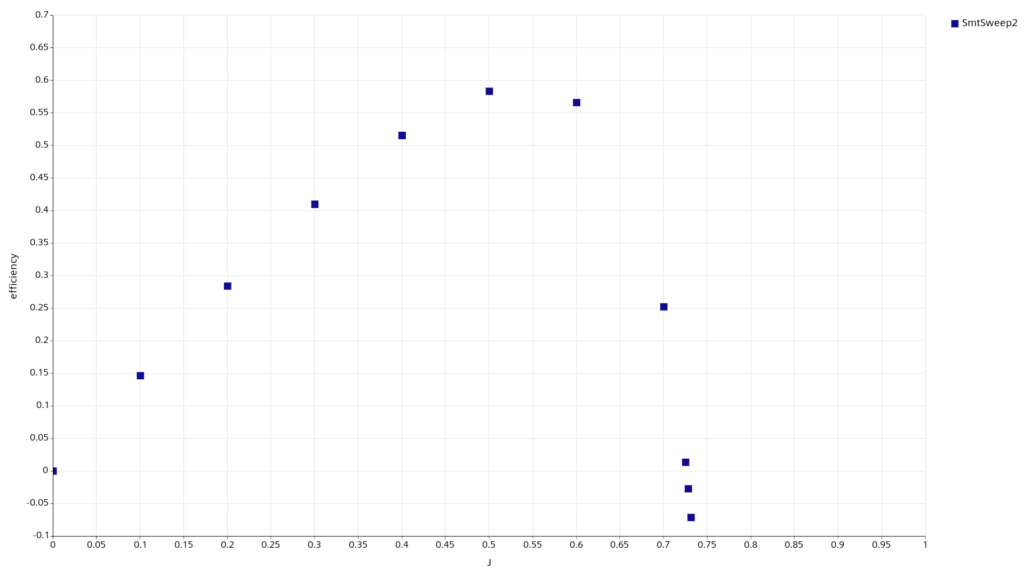
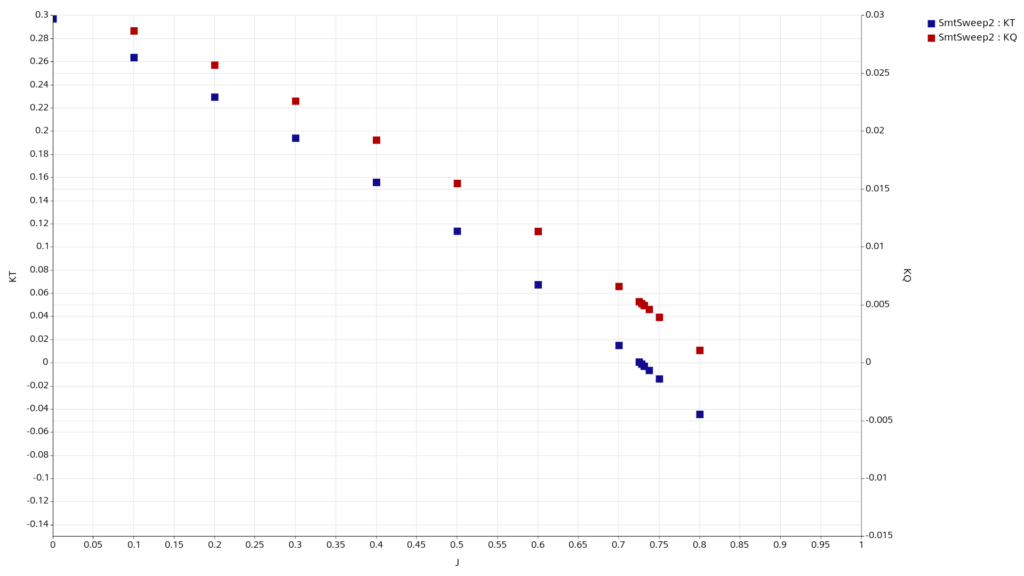
The Smart Sweep function in design manger now allows the sweep to stop then. It provides the appropriate open water propeller curves without any additional runs. Thus, saving the user time and allowing a direct export of the results into the virtual disk model for further usage even under roughest conditions.
Recycle your solution!
The Smart Sweep feature answers simple questions:
- Where to dig? Where do I need to look and refine my analysis?
- When to stop digging? When should I stop – when no more interesting data will follow.
But the Smart Sweep contains another benefit. As if you started digging in an old hole – the results might differ – or be achieved faster.
In many cases, the solution of the previous design provides the best initial condition for the next design run. This is as the flow field converges faster from a better starting point. Smart Sweep enabled Performance Map CFDs can re-use design solutions to ensure the flow field’s history is representative of the real-world history and to achieve faster simulation times by providing the best initial conditions for subsequent designs.
Some applications are sensitive to the history of how an operating condition was achieved, this is the so-called hysteresis effect. It cannot be taken for granted that the lift of an airfoil at a given angle of attack will always be the same. The value can depend on if the angle attack was arrived at by increasing through a series of lower angles of attack or decreasing from higher values. Therefore, getting an accurate characterization of the performance requires the simulation progress through the same sequence of conditions that will be encountered in real-world operation.
… and recycle your projects as well!
New features remind me of old projects. If only I had those features then! To convert the old simulation into a Smart Sweep powered Performance Map CFD did not even take me longer than it took you to read down to here – if you watched every video twice. No issues with the facility management due to opening hours infringements – some clever feature did the job just in time!
How our lecturer would have wondered if we replaced a full course work by one Smart Sweep. I bet he is still giving out the same task to his students nowadays. But if my simulation file “accidentally” got into their possession… that would be a shame, wouldn’t it?
Additional Simcenter STAR-CCM+ 2206 top features will be revealed soon, keep watching! In the meantime, discover the three first new Simcenter STAR-CCM+ 2206 features already released:
- Collaborate effectively on multidisciplinary applications
- Rotor blade aeroelasticity to the rescue!
- A Swiss knife and a light backpack, that’s how I travel quickly


Comments
Comments are closed.
Thanks for this videos , But You don’t post any Tutorial of How doing these simulation . Without any tutorial , These videos are just decorative!