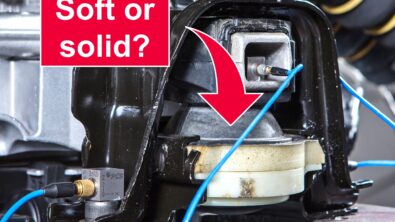
Soft or solid? Latest technologies for controlling nonlinear dynamic mount stiffness in powertrain NVH prediction
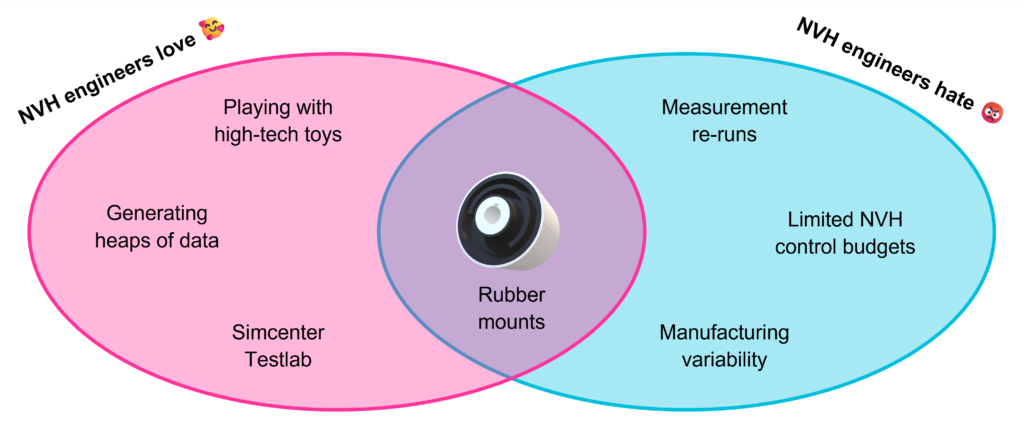
“I passionately love and hate rubber mounts.”
This statement comes from a vehicle NVH engineer working on powertrain integration at one of our automotive OEM customers. Why does a single component cause such strong and conflicting emotions?
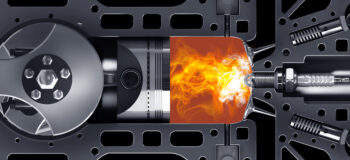
Powertrains are one of the strongest excitation sources in a vehicle. Rubber mounts are indispensable in preventing structural excitations from reaching the cabin (and you!) by decoupling the powertrain from the rest of the vehicle body. Unfortunately, rubber is also an incredibly nonlinear material. This makes it very difficult to predict exactly how effective the rubber mounts will be at decoupling the powertrain in all operating conditions.
This uncertainty is especially problematic in electric vehicle development. Higher torque ranges mean that the mounts are subjected to a wider range of operating conditions, while lower baseline noise levels mean that even small fluctuations in powertrain noise are easily detectable.
In short: NVH engineers cannot live without mounts, but have a hard time living with them too.
But what if we could just keep the benefits of mounts without these drawbacks? In this article, I will explain how to eliminate the uncertainty introduced by nonlinear mount dynamics when predicting (electric) powertrain NVH.
Characterizing nonlinear dynamic mount stiffness
A mount’s effectiveness at decoupling is determined by its dynamic stiffness, which is stiffness versus excitation frequency. To accurately predict powertrain noise in all operating conditions, we need to characterize the dynamic stiffness of the mounts in function of their nonlinear dependencies.
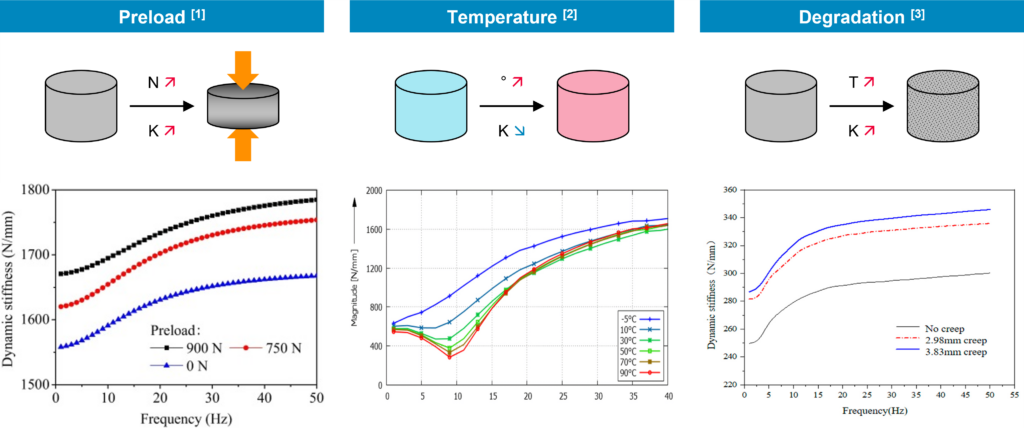
Which nonlinear dependencies should we consider? In context of NVH engineering, our primary concern is the effect of preload. Mounts experience various degrees of compression due to the weight of the powertrain and the torque it delivers, which tends to increase the dynamic stiffness of rubber1. Other dependencies worth mentioning are temperature (rubber tends to soften with heat2) and degradation (rubber tends to stiffen over time3).
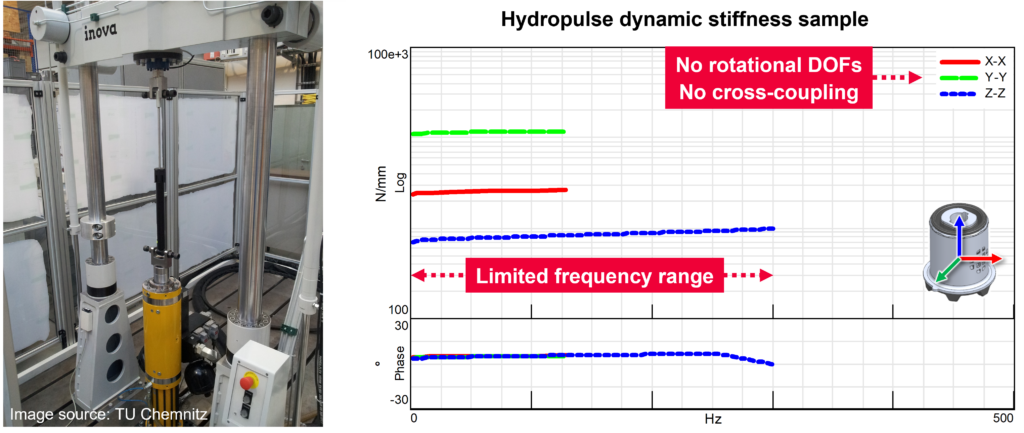
Historically, the dynamic stiffness provided by suppliers in mount data sheets is typically measured using direct methods such as hydropulse test benches. While these methods produce reliable results, their usefulness for powertrain NVH prediction is limited by their frequency range (up to 100 – 500 Hz maximum) and simplicity (only translational Degrees Of Freedom (DOFs)).
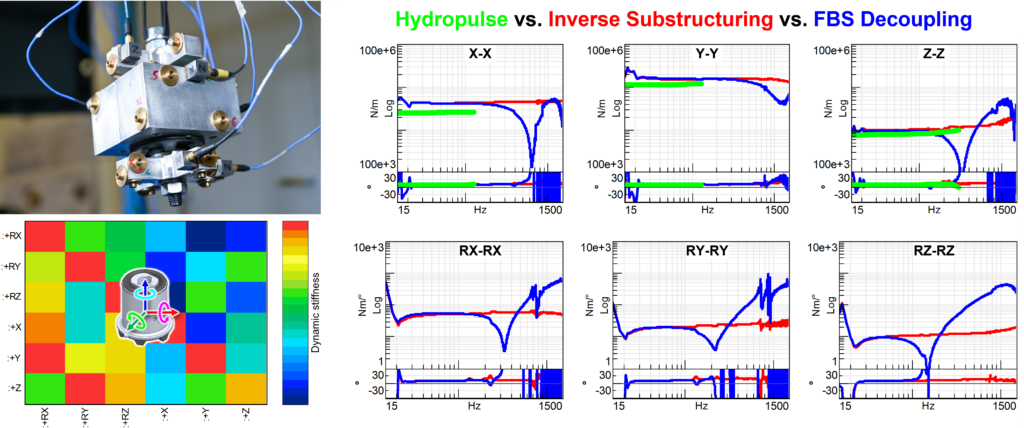
NVH engineers need more advanced dynamic stiffness characterization methods which not only take into account nonlinear dependencies, but also provide results up to higher frequencies and complexity. In a previous article, we discussed two of the methods which we use at Siemens: Inverse Substructuring and FBS Decoupling. The former provides a fast but simplified mount model, while the latter exchanges higher measurement effort for higher model fidelity.
Inverse Substructuring and FBS Decoupling are both based on a technique called Virtual Point Transformation (VPT). This technique allows dynamic stiffness to be estimated up to very high frequencies (roughly 4 kHz maximum4) and with full complexity (6×6 matrix including rotational DOFs and cross-coupling).
However, a necessary boundary condition for both Inverse Substructuring and FBS Decoupling is that the mount assembly must be suspended in free-free. How can this requirement can be combined with nonlinear dependencies such as preload, which require external forces to be applied? Is it even possible?
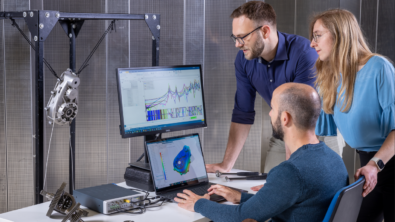
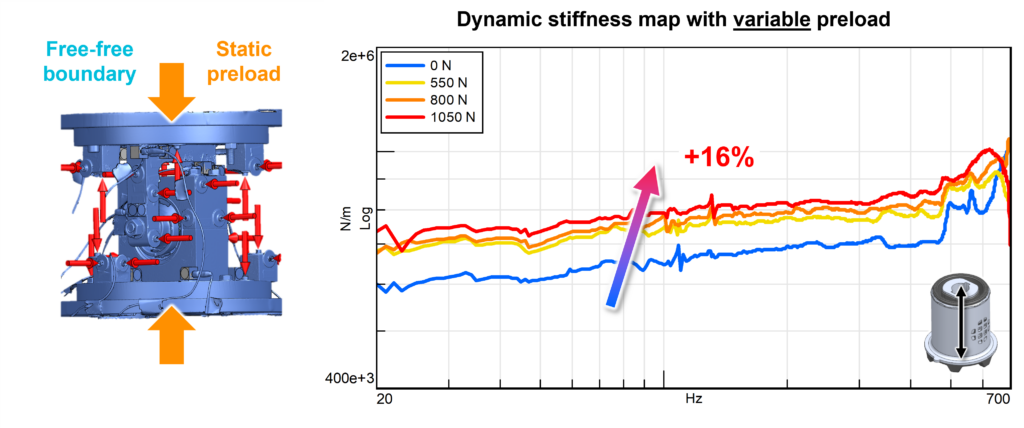
Our engineers at STS Practice have developed a custom mount test bench which does exactly that. The mount assembly is suspended in free-free using a soft spring system, which can be placed under static preload using a linear actuator. Using this setup a dynamic stiffness map can be constructed at discrete preload points using either Inverse Substructuring or FBS Decoupling as desired.
Predicting powertrain NVH performance
Our final goal is to use these mount characterizations to accurately predict powertrain NVH performance in a wide range of operating conditions. The process we will use to achieve this is called Virtual Prototype Assembly (VPA).
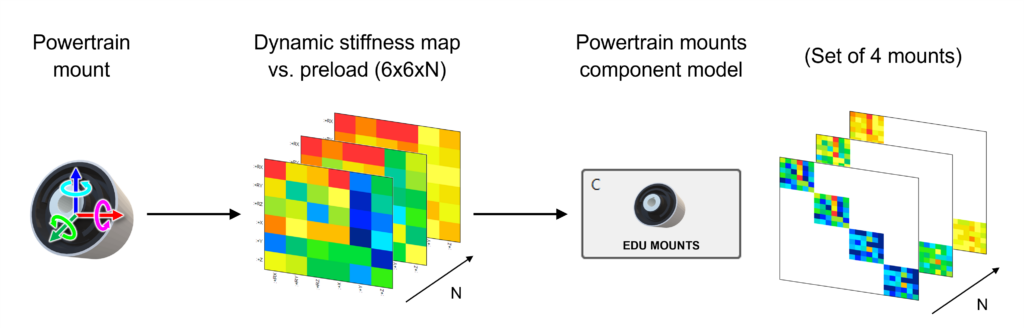
In VPA, the powertrain excitation paths are separated into discrete components, which are each modeled using ‘invariant’ data (FRFs, ‘blocked’ forces, dynamic stiffness, …) at their connection interfaces obtained using test-based or CAE-based methods where appropriate. For example, each mount can be represented by a set of 6×6 dynamic stiffness matrices (between all translational and rotational DOFs, from active to passive side) in function of preload. Several of these dynamic stiffness matrices can then be collected in a component model which represents a full powertrain mount set.
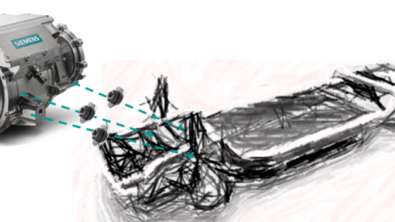
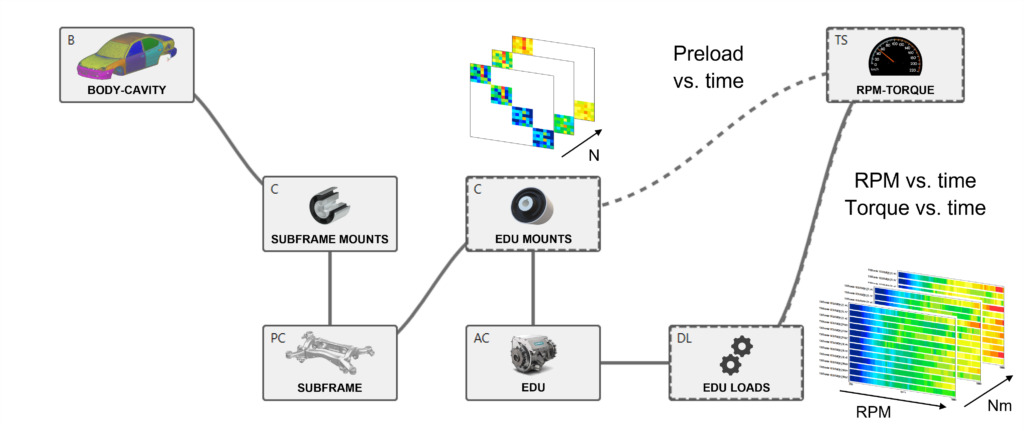
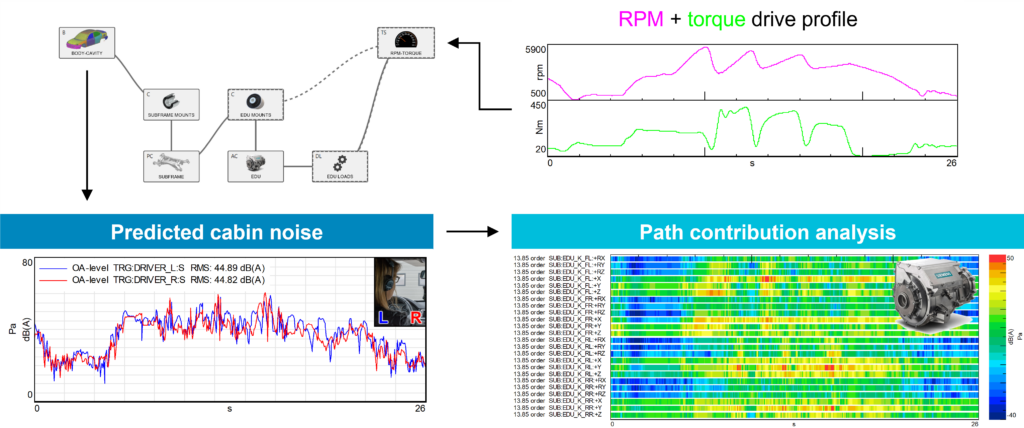
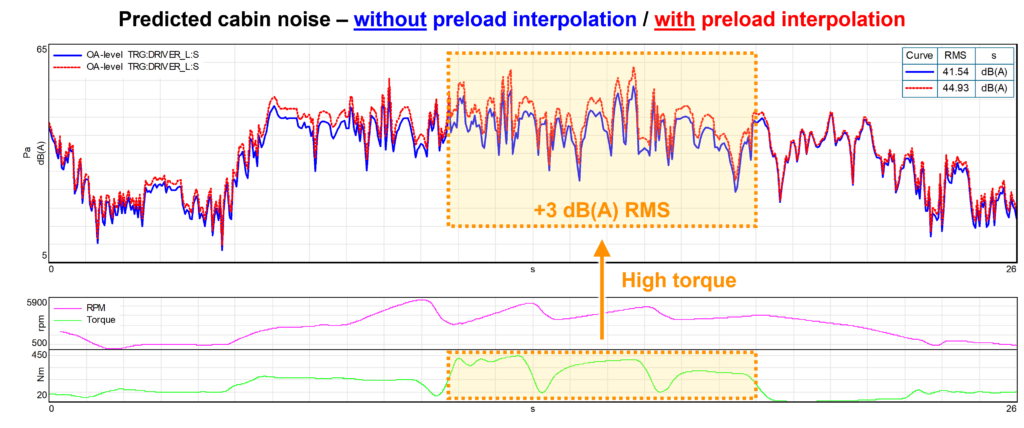
An example of a full vehicle VPA model for predicting powertrain NVH is shown below. In this case, the invariant loads of the powertrain have been measured in function of both RPM and torque. The virtual prototype is ‘driven’ by a test scenario that applies a specific RPM/torque profile to this powertrain loads map. At each torque level, the dynamic stiffness of the powertrain mounts is obtained (or interpolated) at a calibrated preload level.
The result will be the predicted target NVH responses (e.g., cabin microphones) for the given vehicle configuration in the given test scenario. These results can be further decomposed into partial contributions (e.g., per mount path) to study the effectiveness of potential redesign strategies. This process can also be repeated for other vehicle configurations (e.g., exchanging powertrain mount sets) to perform sensitivity studies.
Important to ask at this point: was it really worth going through the extra effort to perform a nonlinear characterization of the mounts? How much difference would it make if we just performed a standard mount characterization (in free-free) and ignored the preload interpolation?
The difference is massive! At high preload, typical dynamic stiffness variations in powertrain mounts could increase the cabin noise contribution by a whopping factor 2 (+3 dB(A) RMS).
Understanding and controlling such variations due to nonlinear dynamic mount stiffness could easily make the difference between failing or achieving an NVH performance target.
More please!
Has this article left you curious about the technology and process behind predicting NVH performance using virtual prototypes? Watch our free on-demand webinars on Component-based Transfer Path Analysis (C-TPA) and Virtual Prototype Assembly (VPA) to learn more.
Or visit the Simcenter Community to discover what else is new in Simcenter Testlab 2406.
- Xia E., et al., A modified dynamic stiffness calculation method of rubber isolator considering frequency, amplitude and preload dependency and its application in transfer path analysis of vehicle bodies, Applied Acoustics, Vol. 175 (2021) ↩︎
- Koch P., et al., Influence of Rubber Temperature on Transfer Functions of Bushings, SAE International, 2015-01-9115 (2015) ↩︎
- Fu J., et al., Rubber Creep Model and Its Influence on Mounting Stiffness, Applied Sciences, Vol. 12-24 (2022) ↩︎
- Wagner P., et al., High frequency source characterization of an e-motor using component-based TPA, SIA NVH, Amitronics, Siemens, BMW (2021) ↩︎