Frequency Response Function measurements on permanent magnet rotors
Simulation engineers are under constant pressure to increase modeling fidelity and efficiency. The ability to use a Digital Twin to simulate product behavior has become increasingly important. In recent years companies race to get products to market faster by reducing development time and costs.
However, simulation alone does not always ensure a product will perform as expected once it is in service. Accurate data and correlation techniques will help engineers build better models with much higher accuracy. In this blog post, we will explore how engineers can capture high-frequency FRF data on a permanent magnetic rotor. We will demonstrate a practical way to excite one, enabling accurate Frequency Response Function measurements and higher-fidelity, more efficient models.
Solving sticky hammers using Frequency Response Function (FRF) measurements
Those who have tried it will know: Modal impact hammers tend to stick to magnetic parts of electric machines.
After you spend time getting accustomed to the progressive pull force the magnet is imposing on the hammer, you’ll be able to hit the rotor. On inspecting your results though, you’ll often find multiple points of impact from the hammer.
Next to that, you’ll find it difficult to get sufficient force into the higher frequencies, even if you’re using the hardest impact tip.
Let’s explore how we can excite the rotor without these measurement errors. For that, we will be using the High Frequency Shaker to collect data up to frequencies exceeding classic excitation methods.
The High Frequency Shaker
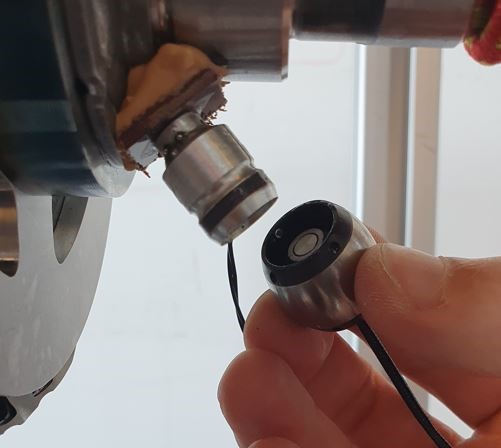
The Simcenter High Frequency Shaker is an electrodynamic inertia exciter. It is superglued to a part or inside an assembly and generates a well-defined, repeatable point force. This short video snapshot shows this in action.
The integrated force sensor, which is aligned with the stinger by design, provides the input force reference signal for the FRF estimation.
It is composed of two modules:
- The inert mass with permanent magnet and unidirectional force sensor
- A stinger which contains the “voice coil”
The inert mass snaps directly on the stinger, making installation easy and fast.
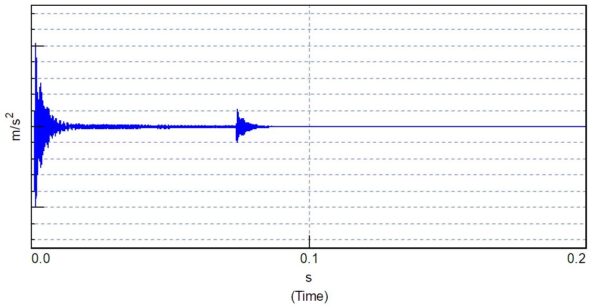
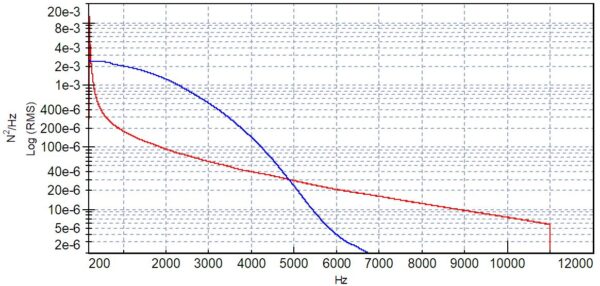
Now, the setup is ready for data collection for up to 10 000Hz. The excitation signal spectrum can be freely chosen, enabling high frequency excitation as can be seen in the following plot. The excitation is fully automated, an efficiency gain compared to manual impacts using a modal hammer.
Below you’ll find some additional specifications.
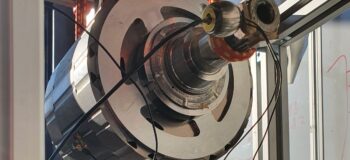
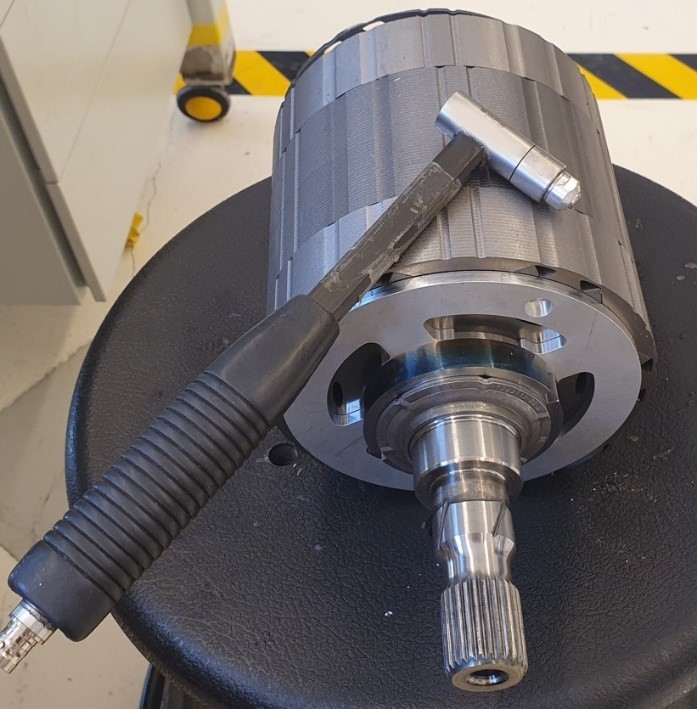
Test Setup of the High Frequency Shaker
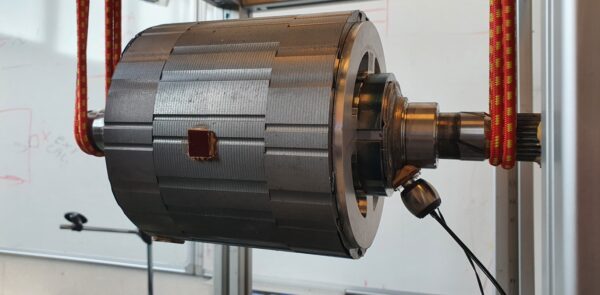
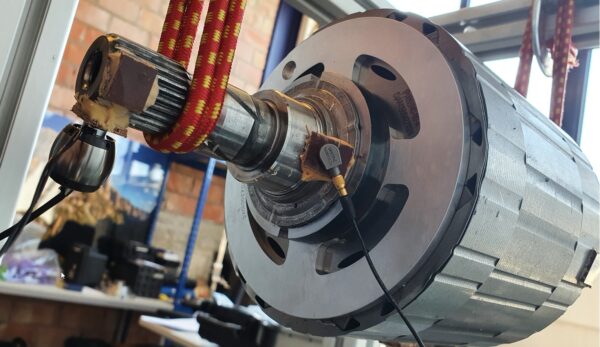
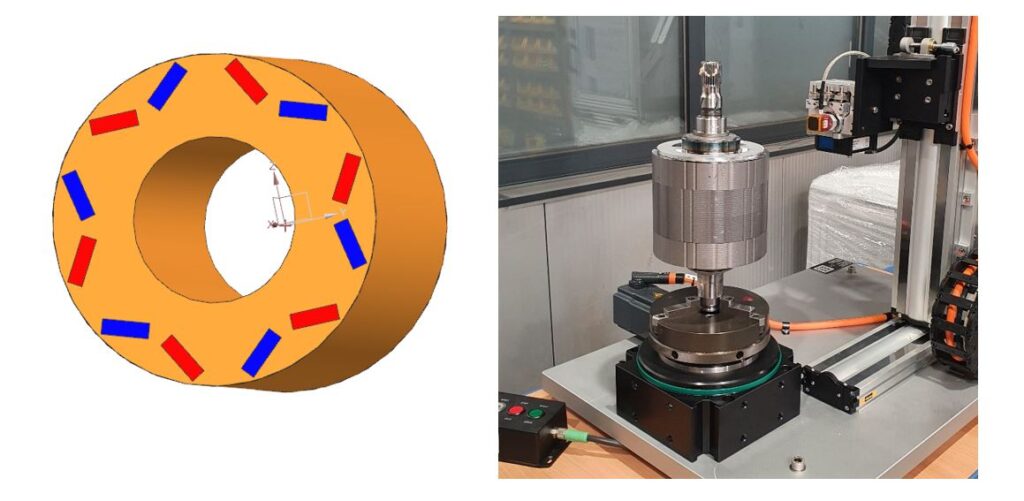
The test object described in this post is a rotor from an electric machine meant for vehicle propulsion. It contains buried magnets in a V shape, which presents a challenge in testing due to the permanent magnetic field that may misalign the shaker. It has been suspended in free-free conditions to replicate the same conditions as the virtual model will most likely have.
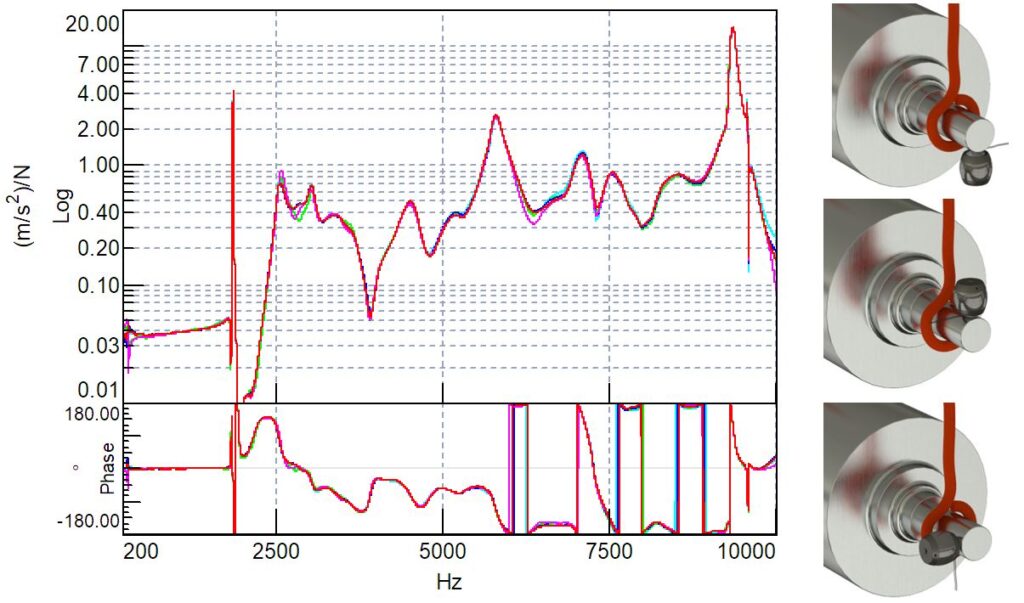
The orientation of the shaker relative to the gravity force direction is unimportant. It can be oriented in any direction. There is no relevant change in generated force or measured FRF. This can namely be seen in the following comparative graph which shows a structural FRF where the rotor has been rotated relative to gravity.
Effect of magnetic field on Frequency Response Function (FRF)
To evaluate the effect of the rotor’s magnetic field on the Frequency Response Function (FRF), the reciprocity principle will be used. For a more generic introduction to reciprocity, see the reference: The Theory of Sound of Lord Rayleigh. In our current scenario, reciprocity states that the FRF between two points on the rotor remains the same after switching the input and output of that system.
According to Rayleigh, the reciprocity holds for all linear, passive, systems that contain only reversible elements that vibrate harmonically.
Mechanical reciprocity:
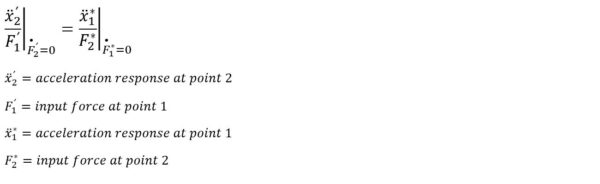
The static magnetic field is passive and we can therefore assume it is reciprocal as the deformations of the rotor are very small. In this case, we identified two ports that we would like to determine the Frequency Response Function between.
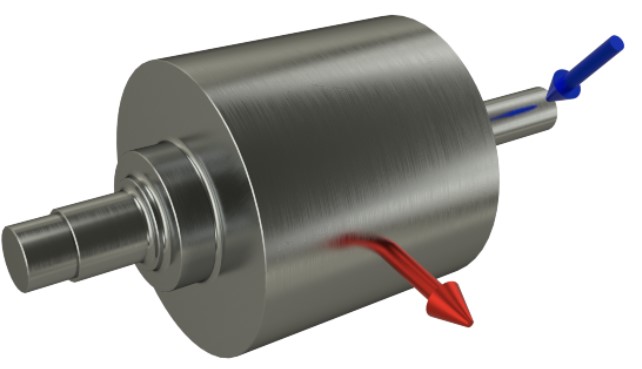
The red arrow indicates port 1, which is in a strong magnetic field.
The blue arrow indicates port 2, a location where the magnetic field is significantly lower.
When magnetic fields come into play, several consequences can spoil that reciprocity. The inert shaker mass, which also contains a powerful magnet, could be attracted to the rotor. This may cause misalignment or a limitation of the stroke. It could also result in a changed mass loading compared to condition in direct excitation.
A comparison can now be made using the two measured FRFs. In the following Bode diagram, the complex direct and reciprocal mechanical FRFs are compared.
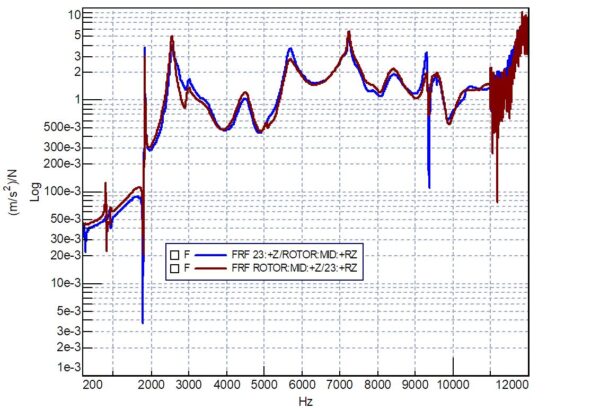
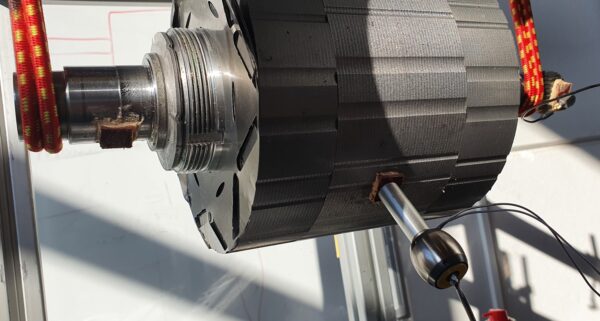
As you can see, in the frequency range of interest, the two Frequency Response Functions match up quite closely. The tool we used to enable excitation at the punched rotor discs, in the vicinity of the magnets, is an extension tube that comes as part of the High Frequency Shaker product package.
This enables us to move the shaker away from the rotor. The tube is light and dynamically stiff enough to transfer the force without any relevant effect.
Magnetic flux density determination.
To quantify the flux density the shaker is exposed to, we can go two ways:
- Build a model in Simcenter 3D Magnet and predict the magnetic field
- Use a sophisticated hall affect array to quantify the field experimentally.
For the sake of satisfying our curiosity, we compared both methods. Below you can find the two arrangements, namely a virtual model and the rotor core in the Magcam automatic field mapping chuck.
Both exercises are taking less than half a day and we have two very interesting results as can be seen in following figure:
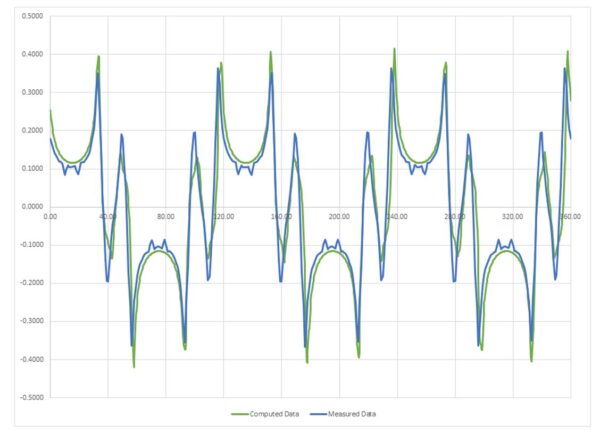
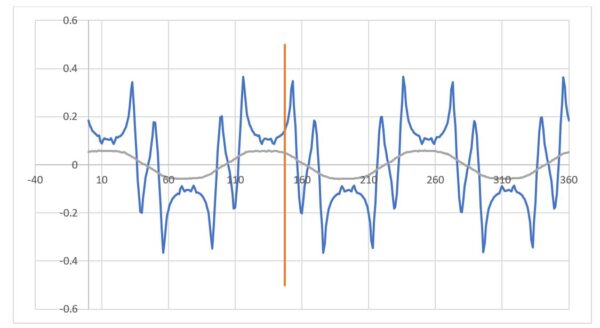
The curves show the magnetic field flux density. Close to the surface, the radial field strength was up to 0.4 Tesla.
Using the extension element, the field strength reduced to 0.05 Tesla. The field strength at 20mm distance from the surface is shown by the grey curve in the plot below.
Evaluation of Frequency Response Function (FRF) measurements
As is demonstrated by the good match between the direct and reciprocal Frequency Response Function (FRF), the presence of the magnetic field around the exciter does not influence the FRF.
Even though the shaker contains an electrodynamic drive, the quality of the FRF is assured when measuring on an object with a permanent magnetic field.
The inert shaker thus provides data in a faster way, with a smaller measurement uncertainty and up to higher frequencies. This enables engineers to do analysis more thoroughly and efficiently.
Since the shaker is self-supporting, these parts can even be tested when they have been integrated in an assembly. Read more about other challenges with interior excitation of assemblies here: https://community.sw.siemens.com/s/article/Using-Qsource-Shakers-in-Harsh-Environments
For any questions or comments, contact me at tom.knechten@siemens.com
You can leave any comments down below as well.
You’ll find here the specifications of the setup and a set of useful links related to this topic.
Specifications:
| Outer Dimension | Ø20 X 25mm height (30mm incl cable) |
| Mass (total) | 30 grams |
| Dynamic mass loading | 3 grams |
| Stinger footprint | Ø8mm |
| Intended frequency range | 300-10000Hz |
| Amplfier requirement | Q-AMP230V |
See this table showing the data acquisition settings:
| Excitation signal spectrum | Multi-sine pseudo random, pink-ish |
| Frequency range | 300 – 10 000Hz |
| Rms force level | 1 N |
| Number of averages | 40 |
| windowing | Uniform/uniform |
| FRF estimator | H1 |
References:
- Installation of High Frequency Shaker a video
- Simcenter 3D magnet: link to youtube video or PL website
- Blogpost on pseudo random excitation signals
- Siemens website


