Battery Mechanical Abuse – The big vibration test for EVs
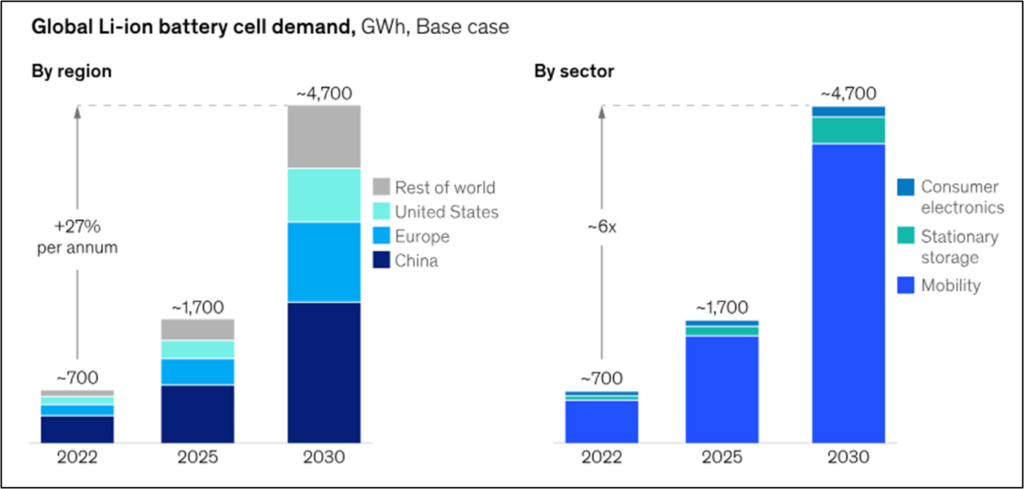
Electric vehicles were a rare sight in the suburbs of Cincinnati where I live, until a year ago. Plug-in hybrids and EVs such as Tesla cars have become more common. The global markets are not very different from the local phenomenon that I observed. According to McKinsey reports, electric vehicle sales grew by about 90 percent in both Europe and the USA and grew a whopping 300% in China.
One of the important components of an electric mobility vehicle is the battery and it is no surprise that global battery requirements are growing at a steady pace and constantly evolving
Challenges – Vibration tests and Crush tests
When batteries are used in vehicles, the battery packs or battery modules must meet certain safety and reliability standards. That is, they must be designed to work fail-safe against abuse or harsh operational conditions. Various Organizations have come together and have defined what constitutes the abuse test. Most standardized abuse tests cover mechanical, thermal, and electrical testing.
Mechanical testing can be further broken down into two main categories: (a) vibration tests, and (b) crush tests. The focus of this blog is to address battery vibration testing.
Vibration testing is pivotal for an effective battery pack or module design, therefore, several independent standards for vibration testing have been developed by various governing bodies. Here is a list of some of the standards for vibration testing
| Standard | Description | Type of excitation |
| IEC 62660-2 | Secondary lithium-ion cells, battery packs and battery systems | Random, Shock response |
| SAE J2380 | Vibration testing of electric vehicle batteries | Random |
| ISO 19453-6 | Traction battery pack and systems | Random, Shock |
| ISO 6469:1:2019 | Safety specifications, rechargeable | Random, Shock |
| UN 38.3 | Transport of batteries | Sine sweep |
| ISO 12405 | Lithium-ion battery systems | Random |
Random vibration, shock, and sinusoidal or sine sweep tests are the most common vibration tests for batteries. The main differences between the standards are the type of excitation, the vibration profiles, and the frequency range.
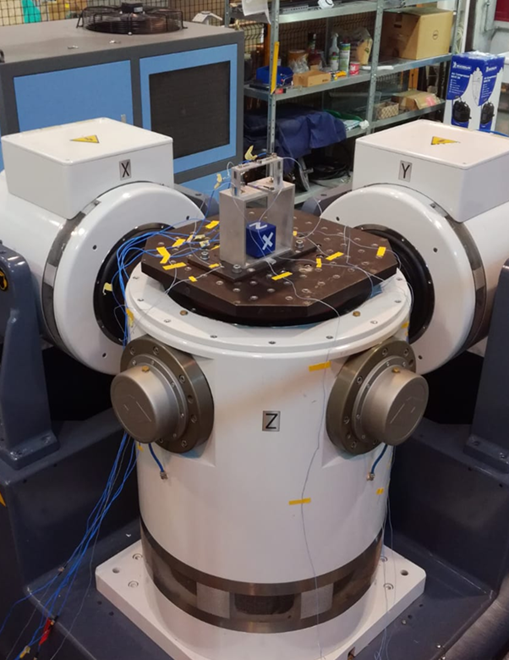
To do the physical testing, batteries are mounted on top of shaker tables and then excitations are applied as defined by the standards organization. If the excitation is required to be applied in three directions orthogonal to each other, either the battery is rotated on the shaker table, or the shaker table mount is rotated to apply the desired vibration profile. The purpose of the test is to ensure that there are no failures.
Physical testing requires a prototype be mounted on shaker table. If the battery fails the test for whatever reason, it must be re-designed and re-tested – a process that can become expensive very quickly and time consuming. If the battery manufacturers need to sell into other global markets, they will have to comply with corresponding standardized tests. It is easy to see how this can increase the production costs.
Virtual Testing – Finite Element Analysis
A big advantage of virtual testing is that it is indeed virtual. Design changes can be conceptualized and put to virtual test to see if the battery is likely to fail. That is, with virtual testing we can easily perform what-if studies. While physical testing cannot be eliminated completely, we can reduce the need for the number of tests, drastically. Needless to say, this will reduce the design time and the time to market.
Simcenter 3D
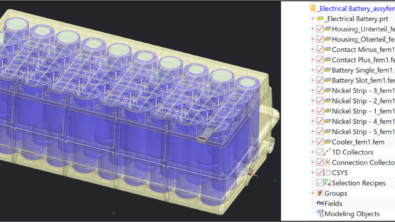
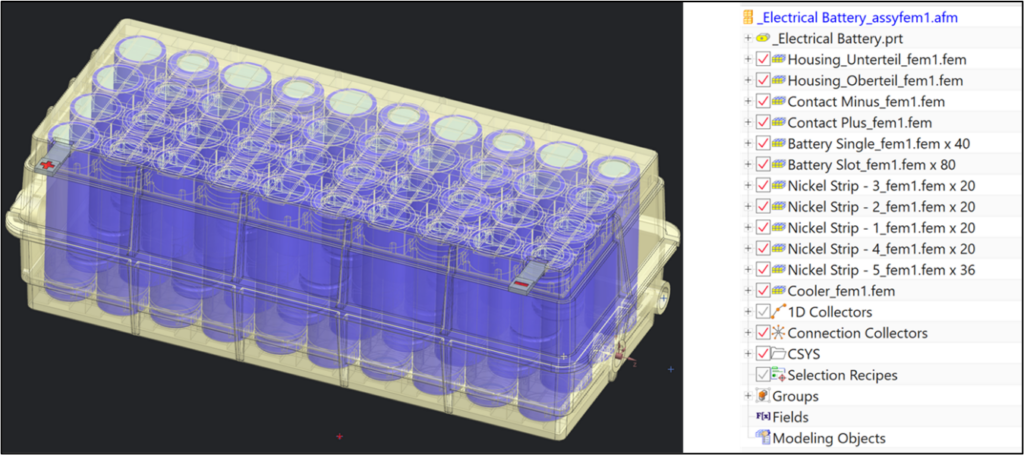
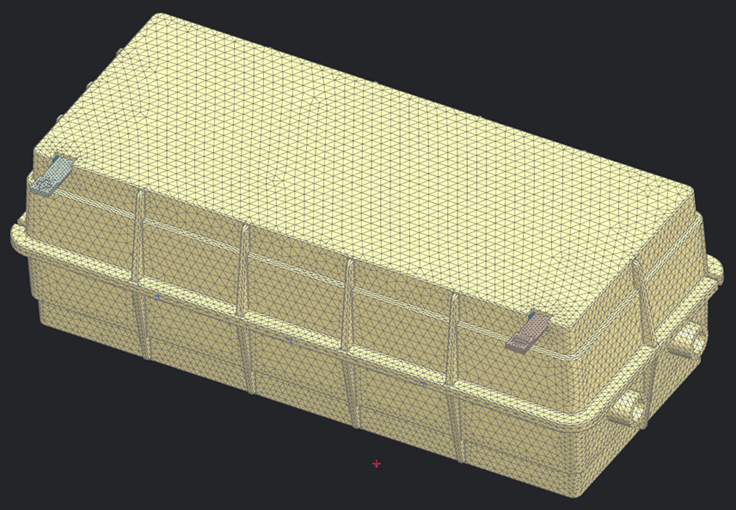
Finite element analysis is an excellent analysis tool for vibration analysis and hence virtual battery testing. With simulation, building the physical prototype is replaced by building its virtual equivalent – a CAD model. It is important here to choose the right modeling tools to make the model building easy. Simcenter 3D desktop is an excellent tool for model building. Simcenter 3D allows you to build complex assemblies of CAD parts. You can create a top-level assembly from a sub-assembly which can in turn include other sub-assemblies or components. Parts can be easily multi-instanced – that is, if you want to create a battery pack with cells, you can start by modeling a single battery cell first and multi-instance the cells in the assembly.
Any design changes to CAD automatically triggers an update of mesh and boundary conditions making the what-if scenarios or design changes easy to perform. Additionally, you can use the concept of templates in Simcenter 3D. These templates capture the workflow. If mesh, excitations, and boundary conditions are created using CAD attributes, these will automatically apply to new models with the same CAD attributes. This way, the analysis can be set up by expert CAE analysts and the templates passed down to design Engineers.
Analysis
While CAD tool selection is important, it is equally important to choose an analysis tool that will expedite the analysis process. Again, Simcenter 3D will fit this bill very well as it is an excellent analysis tool.
Correlation
One of the challenges in simulation is to answer the question: How good is my simulation model? For example, the top and the bottom casing can be modelled with a glue connection between the two parts. This will make the connection very stiff. In reality, connections are localized to a few points because the casings are usually bolted together. The only way to validate the finite element model is to correlate the model with test measurements. Here again, Simcenter 3D provides a model correlation tool to correlate analysis and test models. In addition, it also provides tools to perform model updates by changing parameters to improve the correlation. That is, fixing the model to significantly improve correlation.
Dynamic simulations start with modal analysis. Simcenter product portfolio offers best-in-class analysis software to compute the modes or natural frequencies of the model which can become the start point for model correlation. Dynamic analysis can then be performed directly in Simcenter Nastran or Simcenter 3D Response Dynamics – a tool to compute force response quickly starting from Simcenter Nastran modes. The tool is easy to use and lends itself to what-if studies which are important from a design perspective.
Let us now see how we can perform the battery vibration tests using Simcenter 3D Response Dynamics. Simulating vibration response using Simcenter 3D Response dynamics product involves four steps:
- Reference a Nastran modal solution
- Define damping
- Create a solution (Random, transient, response spectra, frequency response, …)
- Apply excitation
- Solve for responses
Random Analysis
Base shake or virtual shaker analysis can easily be simulated using Simcenter 3D Response Dynamics with an easy-to-use user interface. The process starts with a Simcenter Nastran modal solution damping definition which is then followed by either a “Random analysis” solution or an event is created.
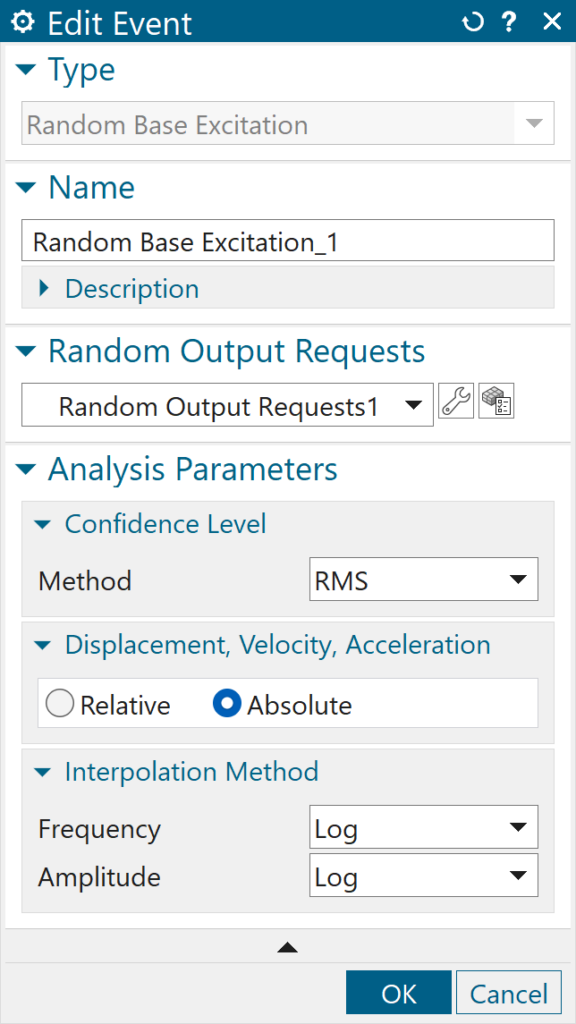
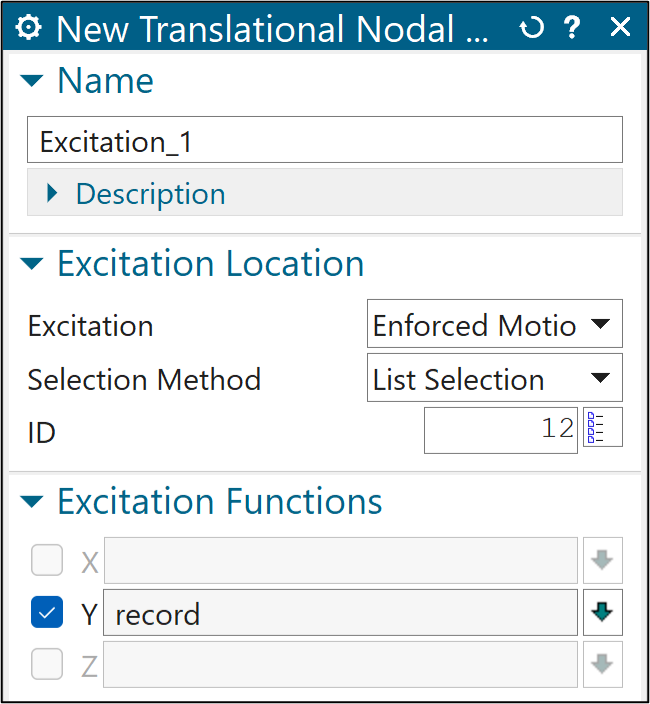
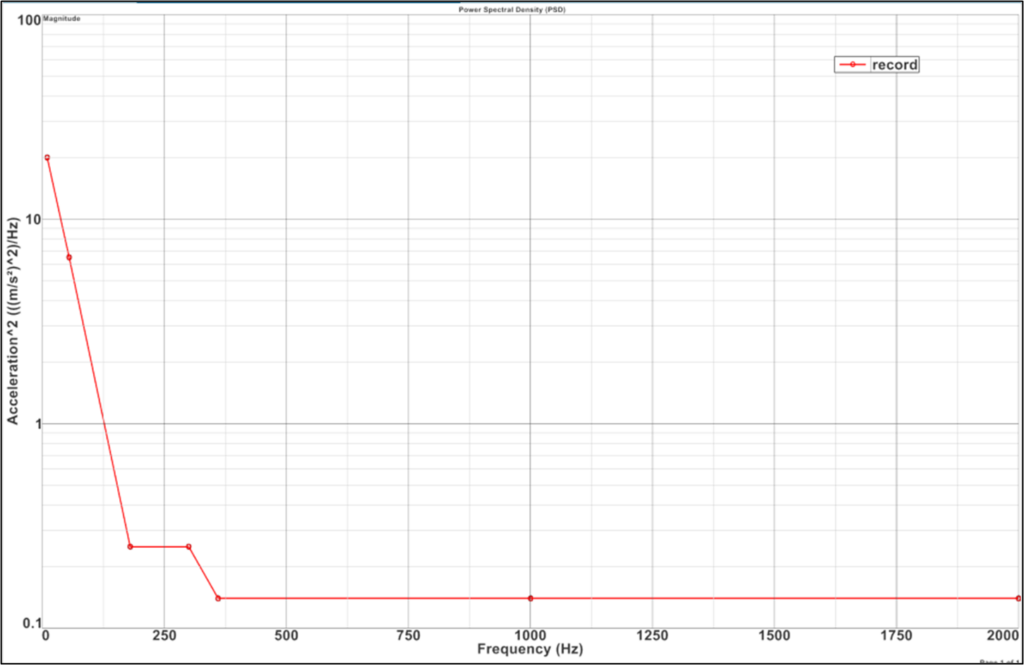
The power spectral density (PSD) data is then input by keying in the data manually or by importing the data from an Excel spreadsheet. Excitation is then applied to the base node that is rigidly connected to the shaker.
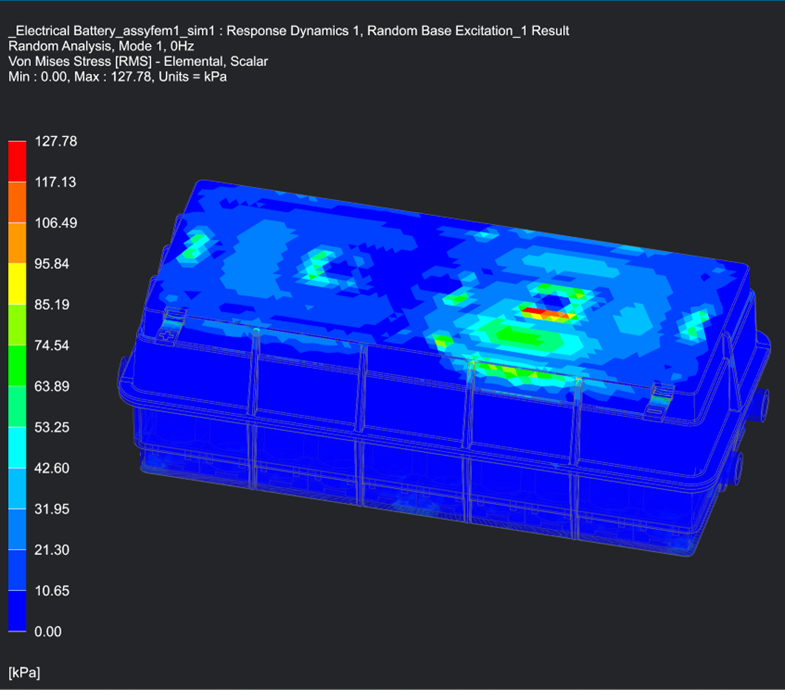
Typically, random response analysis is time-consuming, and its performance dependent on the number of modes and number of elements in the model. However, “Response Dynamics” base excitation analysis uses a proprietary fast algorithm to compute RMS (root mean square) giving it a significant edge over competition. More details on the methodology are available here The outcome of the response analysis solution can be stresses, displacements, acceleration, etc. Von Mises stresses are compared against the failure criterion to determine potential failures.
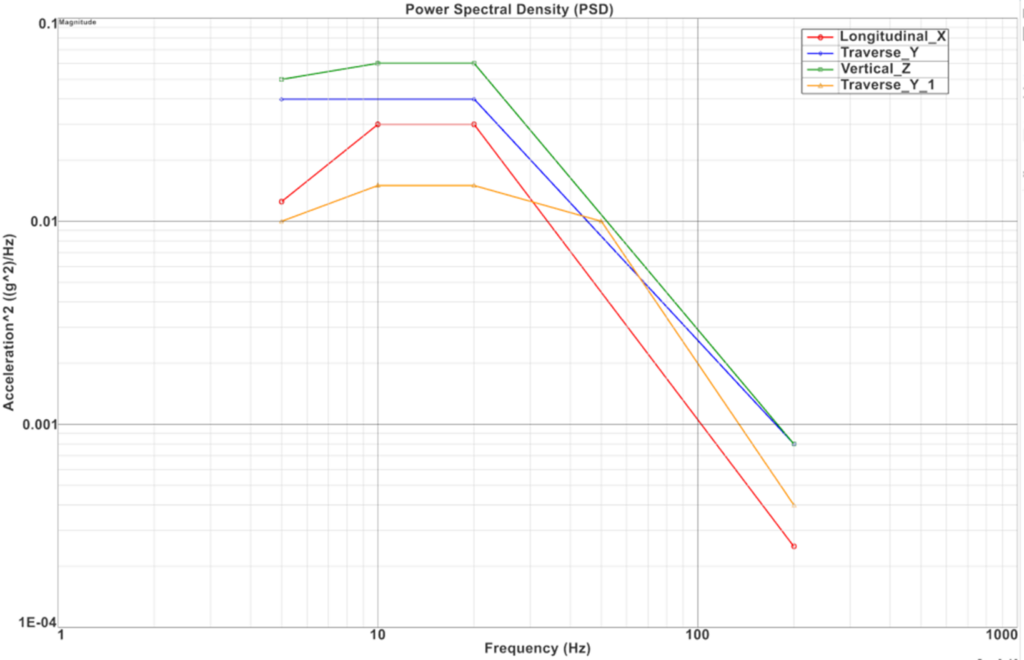
The main advantage of simulation is the ability to apply different PSD of excitation along different directions as per standards requirements. In the same vein, different excitation profiles for different governing standards (ISO, IEN, SAE, etc.) can be applied.
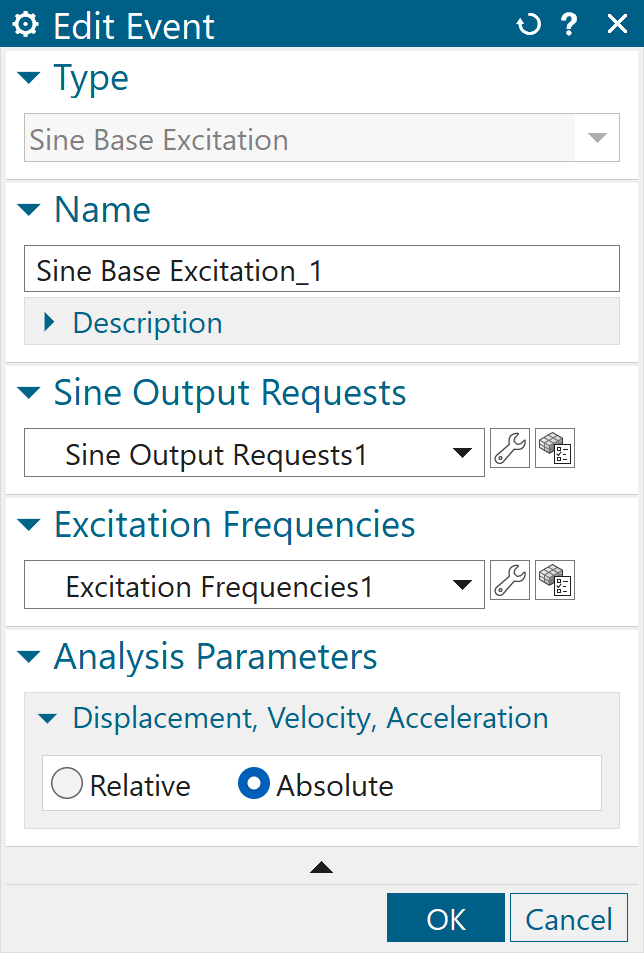
Sine Harmonic Excitation
Sine harmonic analysis is required, for example, UN 38.3 and can also be easily simulated using Simcenter 3D Response Dynamics. It starts with the creation of “Sine Base Excitation” solution or event where excitation frequencies and response requests such as acceleration and stress computations are input.
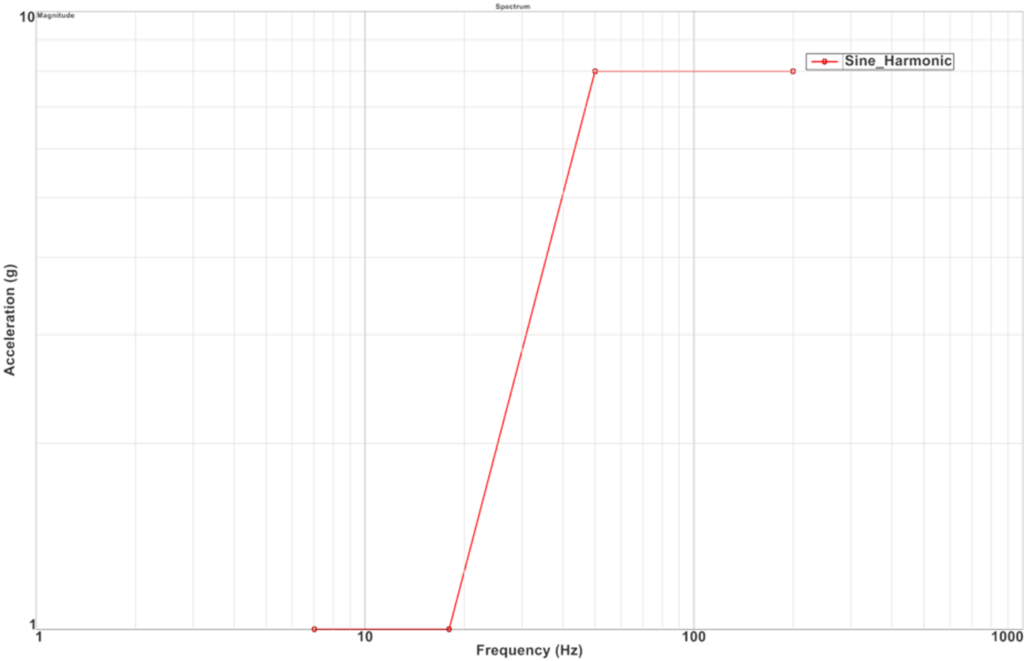
The function tools are used to define sine harmonic excitation just as in PSD. The data is input either manually or imported from a spreadsheet.
While sine harmonic analysis is rather simple, responses such as stress and acceleration results become function of frequency and phase angle. For a given frequency, response results are a function of phase angle and to obtain peak response, results need to be evaluated at various phases angles. Simcenter 3D Response Dynamics has a fast peak response evaluator that can compute the peak responses quickly.
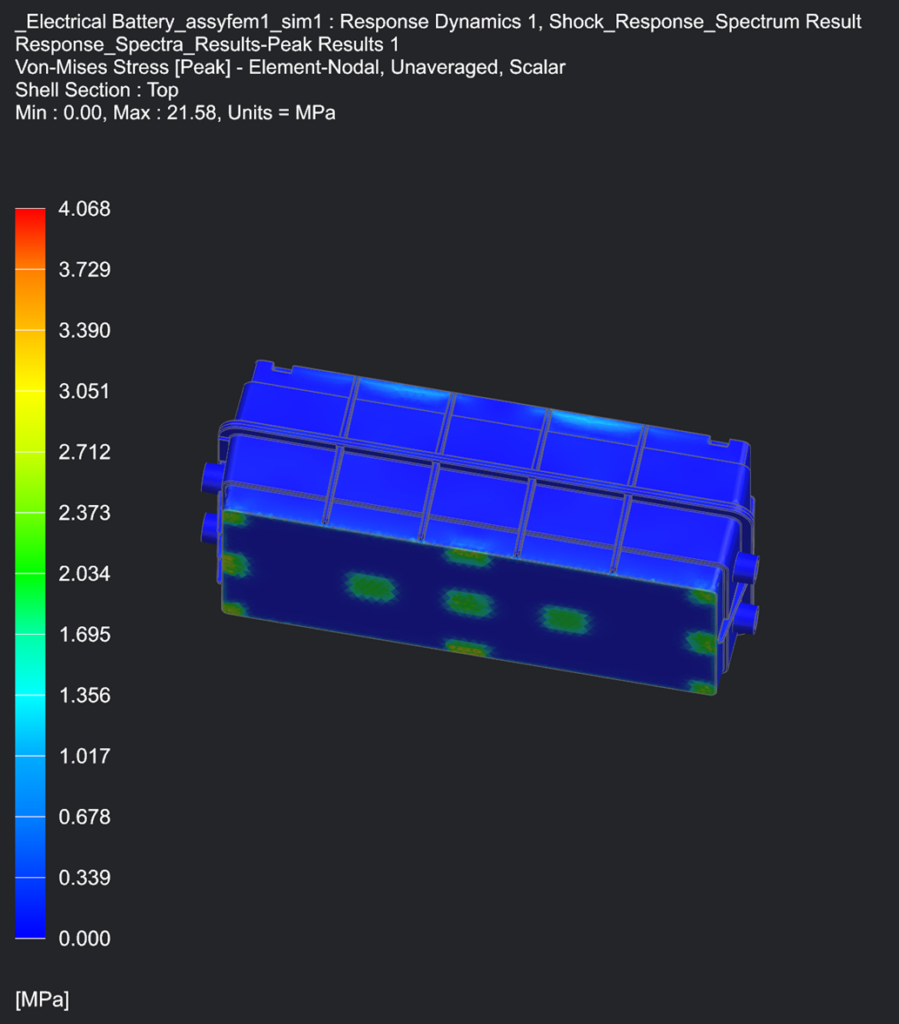
Shock and Response Spectra Analysis
Most standards require a shock response analysis to be performed on the battery. The goal is to characterize battery responses to mechanical shocks that arise in the use of the vehicle. A half-sine pulse is applied as specified by governing standards, and transient response is usually computed. Transient analysis is a rigorous and time-consuming analysis and hence is often replaced with “Response Spectra” analysis.
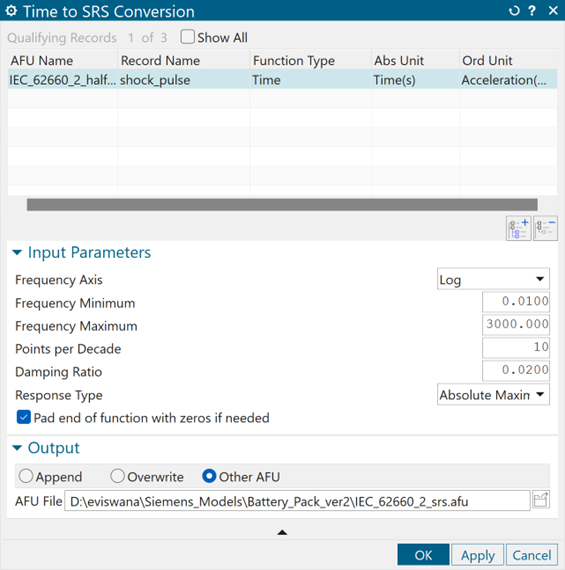
The first step in the “Response Spectra” analysis is to generate “Shock Response Spectra” (SRS). This SRS is then applied as an excitation in the “Response Spectra” solution.
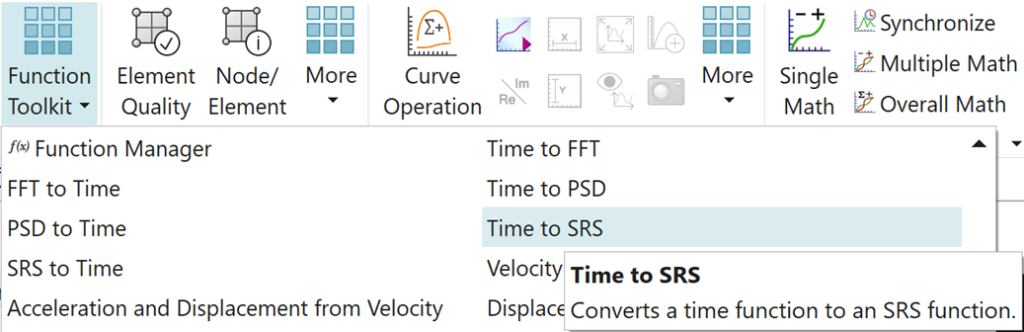
With Simcenter 3D Response function tools, you can generate time signals such as time pulse or time ramp signals with an easy-to-use user interface.
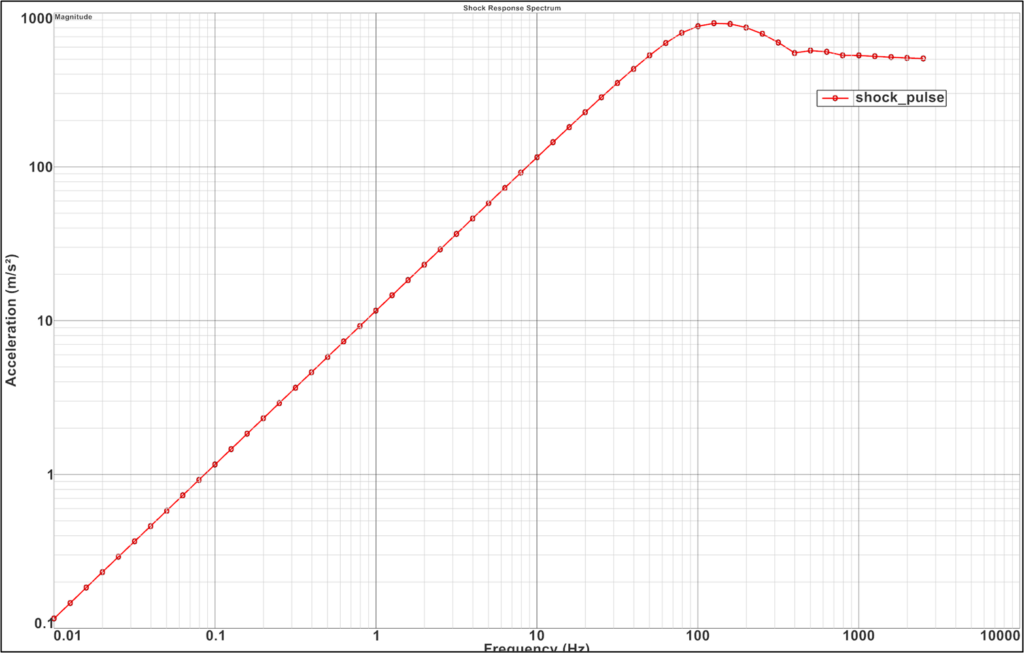
Once the time pulse signal is generated, the shock response spectra (SRS) curves can easily be generated using the built-in function tools in Simcenter 3D response dynamics
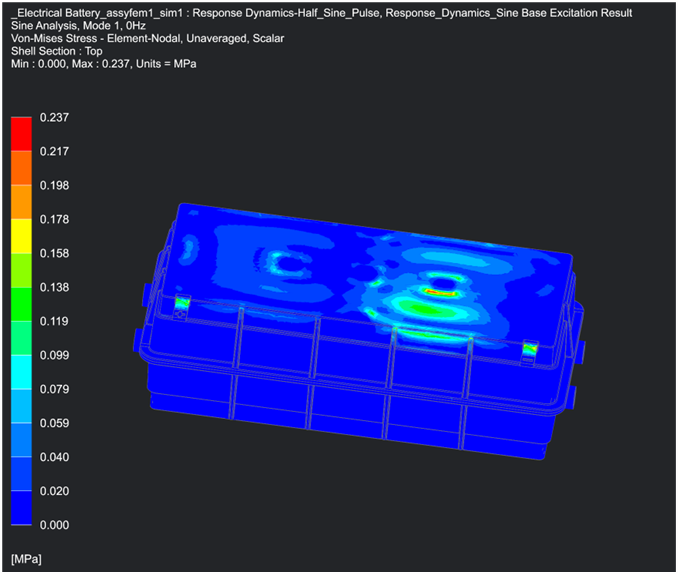
The shock response spectra is essentially based on maximum amplitude excitation and therefore testing the shock response is a method of designing for the worst-case scenario. The figure here shows the von Mises stresses when subject to a shock pulse.
Summary
As Battery pack or modules evolve, the standardized testing methods and criteria change constantly. The number of revisions of each of the standards is just a testimony to this fact. With simulation we can easily keep up with the changing landscape of testing requirements more easily.
Simcenter 3D desktop and Simcenter 3D Response Dynamics with all its bells and whistles provides an excellent platform for virtual vibration tests. With desktop tools such as templates, the tool can be democratized among designers rather than specialists. Allowing the workload to be spread among more team members, removing bottlenecks, shifting the development cycle to the left, automating workflows, and ensuring a faster time to market.
To find out more about battery vibration tests see our webinar or this additional blog