Power busbar design, relax, don’t blow your fuse.
Introduction: DC Circuits Vs The Circulatory System.
To better understand a power busbar, we can consider the human circulatory system as akin to a DC electrical system. The arteries carry blood away from the heart, and the veins return it, which is analogous to the current flow of a DC system. Perhaps, it may have influenced Thomas Edison in developing his DC theory.
The aorta is the primary blood vessel that takes the oxygenated blood from the heart. Therefore, the aorta could be considered a parable to the main positive bus in a DC circuit. As blood travels from the heart, it gradually branches out, reducing to the capillary network that interconnects the arteries and veins. Eventually, the capillary walls are thin enough for oxygen and carbon dioxide exchange. Once depleted of oxygen, the blood can begin its journey back to the heart. Much like, the way electrons flow through the finest wire in the system to generate light in a bulb before returning to the energy source.
Blood is then pumped from the heart to the lungs for oxygenation via the pulmonary arteries. We can consider the pulmonary arteries as another bus set that takes deoxygenated blood from the heart to the lungs. Finally, the pulmonary veins (another bus) take the blood back to the heart, and the cycle repeats itself at 1.2 Hz, i.e., 72 beats per minute!
The greening and electrification trends demand lighter, compact, and efficient power delivery systems. Power busbars are the major arteries and veins that deliver and distribute power from the sources to the loads. Consequently, power busing design needs critical consideration in terms of performance under converter operation, asymmetric loading, short-circuits, thermal and insulation breakdown.
High voltage and high blood pressure
When the arteries in our bodies are healthy, they constrict and expand to help maintain the blood pressure. As we age, their walls stiffen. Additionally, people who suffer from high cholesterol will have deposit build-up in their arteries that restrict blood flow. This resistance to flow elevates the blood pressure as the heart pumps harder to force the blood around the body. Similarly, an electric circuit operating at higher frequencies induces AC effects (eddy-currents and proximity), which require a higher voltage to drive the same current. If the design of the system can not cope with high-frequency effects, it must derate it. Derating is standard practice for in-service induction motors and transformers. Alternatively, we can isolate these frequency effects from the system using filters.
While there is a similarity between the increased blood pressure, due to deposits in the blood vessels, and the higher voltage required to overcome the AC effects, the circularity system has one advantage over an electrical system. The blood vessels can change their diameter to allow more or less blood through to maintain the blood pressure. Conversely, an electrical circuit is fixed, and therefore, engineers have to design robustness and safety into the system from its conception.
The engineering challenge when designing a busbar
Therefore, busbar analysis dictates simultaneous consideration of multiple power sources and sinks to reproduce operational and failure modes. That is, support for various voltages and currents (DC, AC, and PWM), multi-terminals, active (switches), and passive (RLC) components, as discussed in a previous blog. After a complete busbar analysis incorporating the power loss and temperature hotspots, engineers can size busbars and protective devices based on their current carrying capacity. However, several common misconceptions and assumptions when conducting an analysis can be fatal to the product. Let’s look at some of these misconceptions and how software can help prevent any oversight from becoming a safety-critical mistake.
The single-phase-3-pole 400 V – 2,500 A – 60 Hz busbar assembly
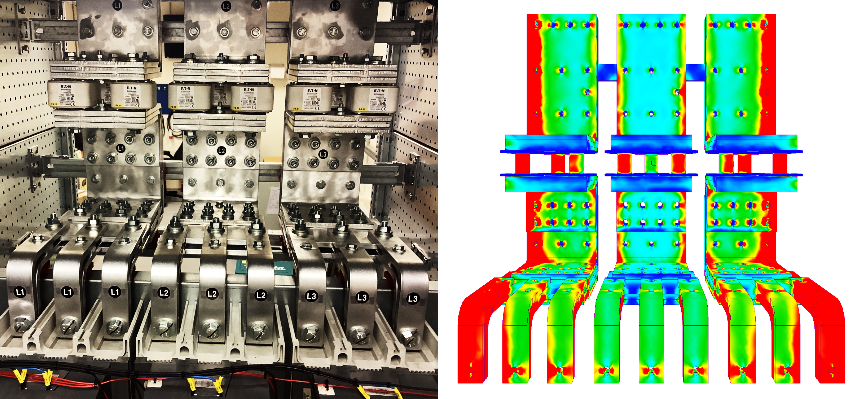
Consider the single-phase-three-pole 400 V – 2,500 A – 60 Hz busbar assembly that terminates in a contactor, as shown in Figure 1. The main bus splits into L1, 2, and 3 busses, and each further divides into an additional three bars. This division of busbars facilitates lower-rated, inexpensive fuses and contactors, which reduces cost and improves redundancy. The L1, 2, and 3 busbars also share a current equalization bar, noticeable on the assembly’s upper part. Each upper bar connects to the lower one via three fuses. Since fuse-sizing is one of the critical tasks, we will use them to constrain the model’s current.
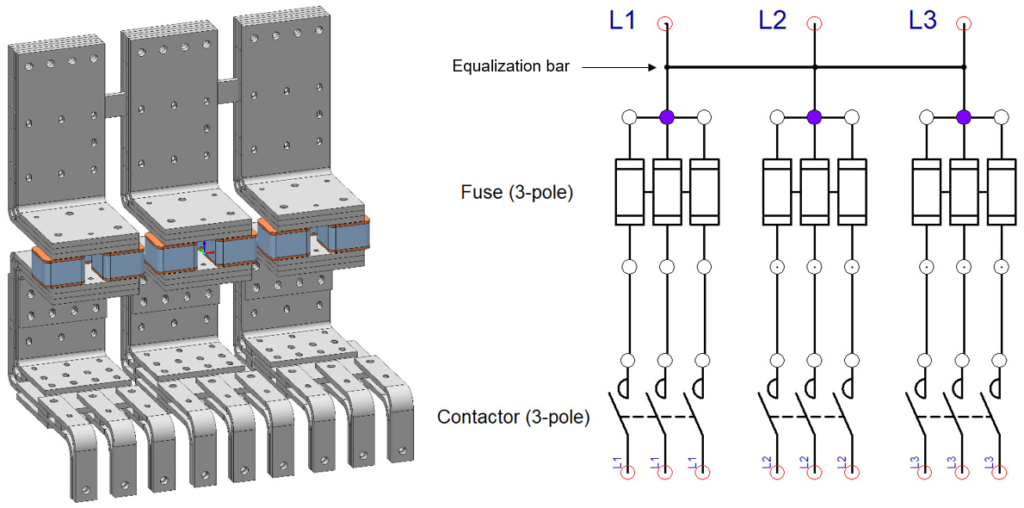
Figure 1: A 400 V – 2,500 A – 60 Hz single-phase-3-pole busbar assembly. L1, L2, and L3 busbars belong to the same phase, and they further split into three bars allowing the use of lower-rated fuses and contactors, as well as improving redundancy
The first misconception that many make is to assume that parallel busbars share the current equally.
1. What if L1, 2, and 3 busbars share the current equally?
Since this is a single-phase busbar system, one could easily conclude that the busbars share the current equally. In our example, the designer would assume L1, 2, and 3 bars carry equal currents, and the circuit in Figure 2 would represent this condition. Hence, we connect the three bars to a current source of 833 A ≈ 2,500 A / 3. The fuse currents are still free to redistribute because they have parallel connections. As evident in Figure 2, the frequency effects result in asymmetric current loading, with the outermost parts of L1, 2, and 3 busbars carrying higher currents. Hence, the highlighted innermost front fuses carry the least currents.
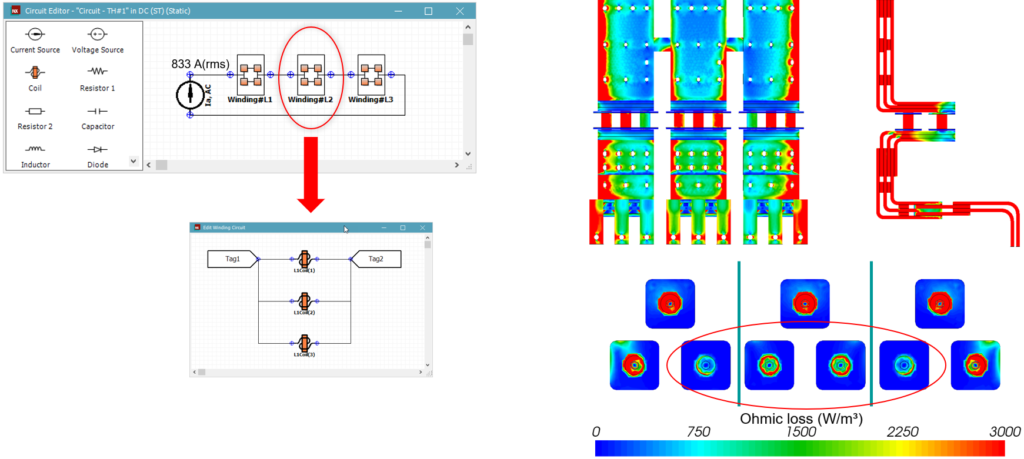
Figure 2: The circuit enforces equal currents for busbars L1, 2 & 3 by connecting them in series, while the fuse currents are free to redistribute enabled by parallel connection. The AC effects result in the asymmetric loading of the busbars and the fuses. In addition, the fuse loading is also affected by the current taking the shortest path.
Protective device sizing often uses inexpensive parts designed to fail in an electrical surge and thus protect the expensive components. In this case, the fuses are our protective device. However, sizing of the fuses is done at the system level, which is divorced from the component level detailed analysis. As we saw in the previous example, a system-level analysis may result in uneven loading of the fuses. However, it is desirable to have the same fuse rating to ease sourcing and manufacture. So, what would a scenario where all the fuses carry equal load look like?
2. What if all the fuses carry equal currents?
If the fuses were to carry the same current in our example, the fuse current is 278 A ≈ 2,500 A / 9, as implemented in Figure 3. The fuse loadings show that although the average fuse current is the same, there is a nonuniformity due to AC effects. The asymmetric current loading of the busbars is like that of the equal bar currents, as busbars L1, 2, and 3 still carry the same current.
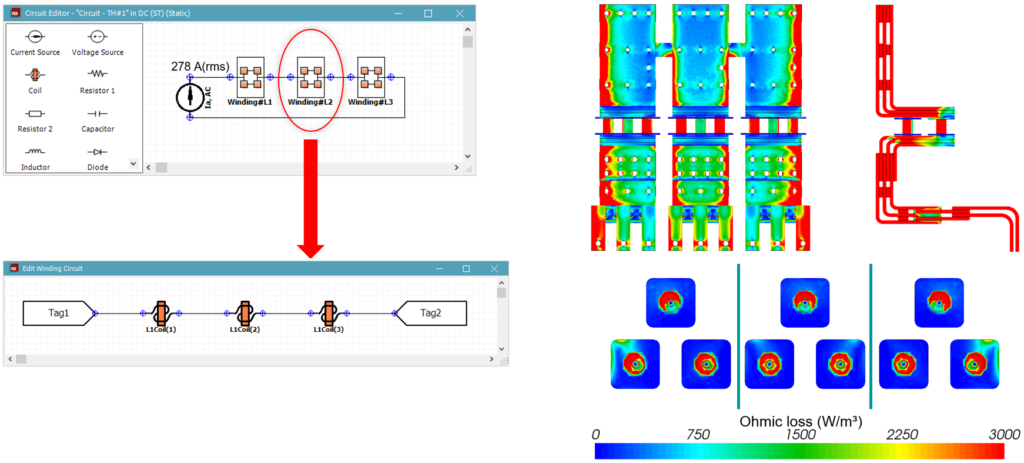
Figure 3: The circuit enforces equal currents in the fuses via series connections. The AC effects result in the asymmetric loading of the busbars and the fuses. In this case, all the fuses have similar peak loading.
The quickest and most common method of protective device sizing is using the power dissipative RMS current to size the busbar. It neglects frequency effects that affect current density distribution. However, neglecting frequency effects affects the cross-sectional area because the current density is assumed uniform along the current path. Therefore, if the current density is not likely to be uniform, the viability of using such a simplified busbar sizing process is called into doubt. Let us take a closer look at how the length of the current path can change.
3. Neglecting frequency effects when busbar sizing
Conventionally, one approach to busbar-sizing assumes the load RMS current has a uniform distribution by neglecting the frequency effects (proximity and eddy-currents) on the current distribution. The SimcenterTM 3D Low Frequency EM 3D static solver is used to test this case. We feed the model with an equivalent power dissipative DC of 2,500 A enforced through the circuit in figure 4. Each L1, L2, and L3 busses has three fuses – 1 at the back and 2 in front. As confirmed in Figure 4, neglecting the frequency effects results in similar loss distribution in the three busbars except for the fuses.
Since ohmic losses are proportional to the square of the current loading, zooming into the fuses shows that the back fuses carry most of the current. The higher loads on the back fuses are because the current takes the shortest path permitted by the parallel circuit connection. This case shows the difficulty of defining the effective current path and cross-sectional area analytically without considering the frequency effects.
The right fuse for your busbar
This result may seem like a reasonable approximation, but with most of the current passing through just three fuses, the designer will be forced to enlarge these fuses. If we consider the three cases again and compare their fuse loadings, as seen in TABLE 1, it is evident that frequency effects and current definition will impact the fuse capacity sizing.
| Bar | Fuse | DC | Equal bar currents | Equal fuse currents |
| L1 | Fuse#1 | 40% | 4% | 23% |
| Fuse#2 | -26% | 21% | -62% | |
| Fuse#3 | -1% | 12% | 31% | |
| L2 | Fuse#1 | -12% | -26% | -45% |
| Fuse#2 | -12% | -26% | -45% | |
| Fuse#3 | -60% | -39% | -10% | |
| L3 | Fuse#1 | -24% | 21% | -61% |
| Fuse#2 | 40% | 4% | 23% | |
| Fuse#3 | 1% | 12% | 31% |
TABLE 1: The comparison of the fuse loadings to the more realistic case, where the solver considered the frequency effects and the current definition to reproduce realistic simulation conditions
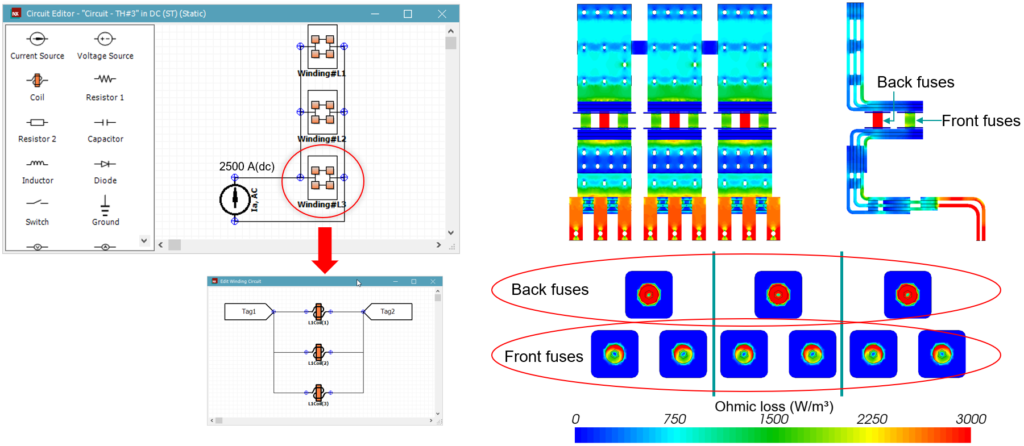
Figure 4: The circuit used in the static analysis where busbars L1, 2 & 3 are connected in parallel as Winding#L1, 2 & 3. Each winding unit has three fuses defined as coils. E.g. Winding#L1 has fuses L1Coil(1), (2) & (3) also connected in parallel. By neglecting AC effects, the current distribution in L1, 2 & 3 is similar, while the fuse loading is due to the current taking the shortest path.
A wrong calculation from a misunderstanding or an inappropriate assumption can lead to a costly redesign. Before making such drastic steps, the designer may decide to investigate further. To further analyze the design, a minimum requirement would be to consider the frequency effects with an AC Time-Harmonic solver. When doing this, the current should be able to redistribute itself freely in the busbar and fuses. This example would result in the following case.
4. We let the solver freely determine the current distribution in the busbars
Using an AC Time-Harmonic solver is the most realistic way to analyze this assembly as the solver freely determines the current distribution in the busbars and the fuses. This is possible by parallelizing the busbars and fuses as the current is unknown beforehand and accounting for frequency effects using the AC Time-harmonic solver. Just like in the first scenario, the outermost parts of the bars carry the most current due to AC effects. Therefore, the encircled innermost fuses carry the least current, as seen in Figure 5. However, since the L1, 2, and 3 busbar currents are unconstrained, the two outer busbars, i.e., L1 and 3, carry 12 % higher current (936 A), while the middle L2 bar carries a 25 % lower current (633 A), while the equal bar current is 833 A! The fuse loadings of TABLE 1 are reference this case.
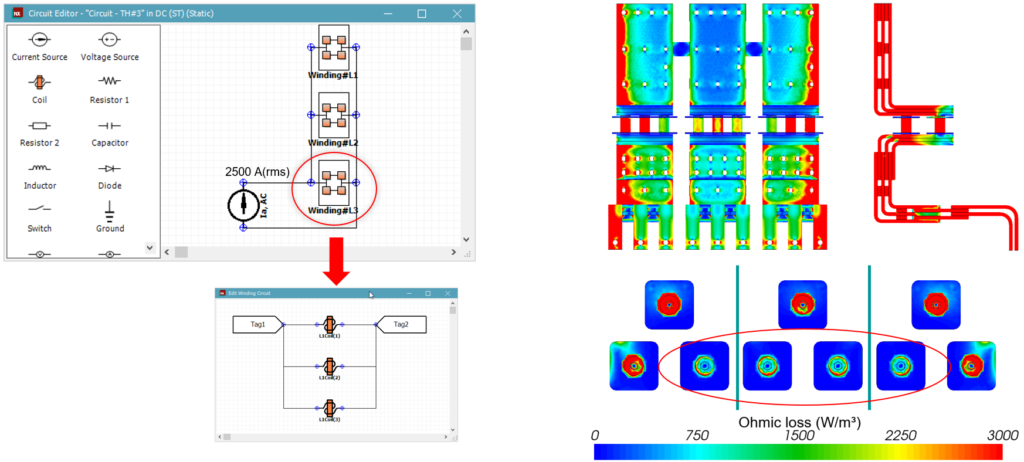
Figure 5: The parallel-connected circuit elements and the AC Time-harmonic solver allow the current to redistribute freely. Hence the accurate asymmetric loading of the busbars and the fuses is possible.
Summary and the pros of a time-harmonic solver
It is now evident that neglecting the frequency effects and improper current definitions will affect the busbar and fuse capacity sizing.
In conclusion, busbar analysis will:
- The use of static solvers underestimates AC effects, hence asymmetric loading and thermal hotspots
- The use of AC Time-Harmonic solvers:
- Accounts for AC effects (proximity and eddy-currents)
- Providing the user provides a proper current definition, the solver can determine the current distribution freely.
- Shows us that although the averaged losses are the same, their distribution matters!
SimcenterTM 3D Low Frequency EM allows engineers to test logical assumptions. In this busbar example, we have seen that busbar and fuse sizing depends not only on the AC effects but also on the current definition!
