Resetting Expectations on Multi-Patterning Decomposition and Checking
By David Abercrombie, Mentor Graphics
Some common misconceptions about multi-patterning processes and just how they work.
It never ceases to amaze me how much confusion and misunderstanding there is when it comes to multi-patterning (MP) decomposition and checking. I sometimes forget just how new a topic it is in our industry. Because of this short-lived history, and the limited time designers have had to acquire any detailed understanding of its complexity, there appears to be some serious disconnect in expectations between the EDA providers of MP tools and the designers and foundries that use them. So, I’d like to spend some time reviewing some fundamental concepts about basic double, triple and quadruple patterning (DP, TP, QP), and how we might all consider changing our expectations based on these concepts.
Let’s start from the beginning. In a DP process, the idea is to decompose a single design layer into two separate masks. Essentially, some of the drawn shapes will be placed on one mask and the rest on the other mask. This is known as decomposition or coloring. It sounds so simple, but as we all know, sometimes the simplest concepts are the hardest to implement. For one thing, you can’t just arbitrarily pick which drawn shapes will go on which masks. Design rule spacing constraints restrict how close shapes on the same mask can be, so you must assign the shapes to the two masks in such a way that any two shapes on the same mask are not too close to each other.
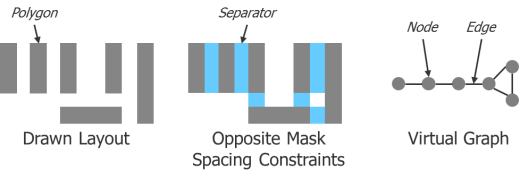
Figure 1 shows a simple example of how a layout and the design rules are captured in software to enable an automated MP tool to accomplish this task. There is a set of six polygons in the drawn layout. Spacing measurements are performed between the polygons to find out if adjacent polygons would break the spacing constraints if they were placed on the same mask. These color alternation requirements are usually referred to as separators. These polygons and separators are then captured in a virtual graph, which the MP tool analyzes to determine if there is a legal way to divide the polygons between two masks, and if so, on which mask each polygon should be placed. Each polygon is represented as a node in the graph, and each separator is represented as an edge in the graph. Note that the virtual graph contains no spatial information (i.e., the size or shape of the polygons, or the relative location of the polygons in space or to each other). This translation from layout to virtual graph is critical for efficiently processing the information to determine coloring.
Figure 1: Translation of a layout into a virtual graph for software analysis.
Figure 2 demonstrates a sample DP checking analysis of this graph. Determining if a graph is colorable in DP is relatively straightforward, as an error is defined as any odd cycle of connectivity in the graph. In this example, there is one odd cycle of three nodes in the graph, which is detected by a simple counting algorithm. Similarly, applying coloring to the graph is relatively simple, since adjacent nodes cannot be the same color and there are only two coloring choices. Starting at any particular point, the tool picks one of the two colors, and then alternates colors as it moves from node to node. A simple O(n) algorithm can accomplish this (where n is the number of nodes in the graph). With this type of algorithm, the runtime essentially increases linearly with the size of the graph.
Figure 2. Coloring analysis of a virtual graph.
If you assume that the layout breaks down into a very large number of small graph components like this example, you probably expect this analysis to be extensively distributed, resulting in very good runtimes. This is the first misconception that needs to be cleared up. In practice, typical designs often form fewer, very large DP components, making it difficult to distribute the processing to a very large number of CPUs.
There is another important point to notice in this example. As you can see, it demonstrates two possible coloring outputs, depending on the starting point. You may ask why pick a different starting point? That is where the next misconception comes into play. When I show an example graph like this on a piece of paper, I have to draw it as a flat plane and pick a particular arrangement and orientation for the nodes and edges. In reality, this graph is generated and stored in memory as a hierarchical structure with no physical orientation. Each node is added to the graph as it is encountered hierarchically by the scan-line parsing through the input layer. The MP tool starts coloring from the first (lowest) point in the hierarchy it has, so the starting point varies with different hierarchies.
Most people don’t realize just how many details can affect the DP coloring process. EDA tools don’t just take the drawn hierarchy as it appears in the layout—they “optimize” the hierarchy to make data processing more efficient. This hierarchy modification varies depending on the input hierarchy, the version of software, the run mode used, the number and types of hardware used, etc. You could easily get a different coloring each time you run the MP tool, even though the input layout is the same. To consistently get the same result, you would have to flatten the data, which would significantly increase runtime and flatten the resulting colored output (to the detriment of downstream processing).
This may shock you at first, as most people lump coloring into the realm of design rule checking (DRC). This is yet another huge misconception that needs to be clarified. The role of DRC is to tell you if something you designed complies with a set of predefined rules. In this example, determining that an odd cycle is present in the original drawn layout, or flagging the fact that two adjacent nodes in a colored layout have the same color, would fit the definition of DRC. However, taking a single layer in a layout and creating two new colored layers out of it does not fit the definition of DRC. It better fits the definition of automated layout generation—something more along the lines of place and route (P&R) or dummy fill generation. With these applications, designers are familiar and comfortable with variations in results run-to-run or release-to-release. We all know that there is more than one “correct” way to route a block. We all know that there is more than one “correct” way to place dummy fill in a layout. We need to become familiar and comfortable with the fact that there is also more than one “correct” way to color a layout. We also have to learn to expect that there is no way to guarantee that you will always get a particular result over and over again.
At this point, you may be squirming in your chair a bit, but you probably aren’t too freaked out. Let me make you a little more uncomfortable, by showing you how this variation in coloring results can also cause a legitimate variation in DRC results.
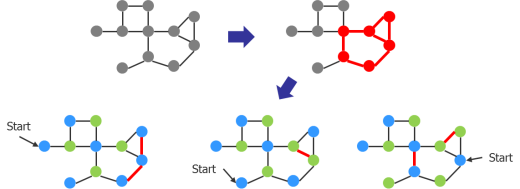
In Figure 3, a relatively simple graph has two odd cycles in it (shown in red). One is an odd cycle of three nodes and the other is an odd cycle of five nodes. They happen to share two nodes and one edge in the graph. There are three possible colorings resulting from three possible starting points. Given a single pass through the graph applying alternating colors (based on our O(n) algorithm), all three coloring results are perfectly reasonable. However, you can see that they produce three different sets of DRC results when you run spacing checks on the resulting colored nodes. Given the two odd cycles, all three of these post-coloring violations sets are also perfectly reasonable.
Figure 3. Example DRC variation in a colored DP graph component.
I know, I know…you want to ask, why not find a way to always produce the coloring shown in the middle, so there is only one spacing violation, instead of the other colorings that produce two spacing violations? This is where expectations and reality collide again. You see, guaranteeing that the tool always finds the particular set of colors that produces the minimal number of post-color spacing violations means it might have to try every possible color combination. An algorithm that tried every possible coloring combination would be O(2^n). Compared to the previous algorithm with O(n), and knowing that as n increases, the runtime increases exponentially, it’s clear this algorithm would have terrible runtimes. In fact, if n becomes large, it could potentially run for days, weeks, years, or a lifetime. Do you want that? Of course not. That’s why the tools don’t do it.
Before you get all worked up, let me put it in perspective. Do you hold the same expectation for a router? There are many times you run a router and end up with a bunch of errors, because the router can’t find a way to route everything. I guarantee you that you could find an alternate set of routes that would produce fewer violations. In fact, in many cases, a human can find a routing that has no errors. In the case of a router, designers don’t even have the expectation that it will find a legal routing if one exists. They just hope it comes close. So why such a different expectation when it comes to an equally challenging problem like layout decomposition? At least in the case of DP, we guarantee the MP tool will find at least one legal coloring, if one exists.
Let’s look at one other aspect of layout decomposition where designers typically have unrealistic expectations—preserving hierarchy vs. density balancing. Everyone knows that having good hierarchy in your data leads to better runtimes in downstream operations. So designers expect the EDA tool to color the design as hierarchically as possible. That translates into trying to color shapes in the lowest level of hierarchy, meaning that all placements of that cell will have the same color. Once the design is colored, designers expect that there will be a nice uniform alternation in color across the design, because the fab has DRC constraints on density balancing (uniformity of color density on each mask and the ratio between each mask in a given region). Given these expectations, let’s look at an example.
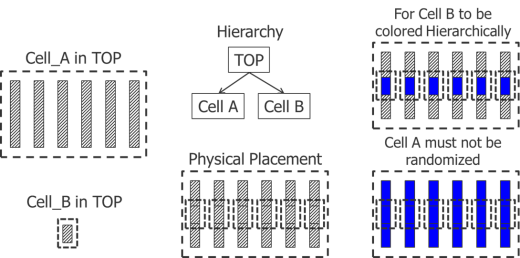
In Figure 4, there are two cells placed hierarchically in a top cell. Cell A contains a series of parallel polygons with sufficient space between them such that their coloring is arbitrary (that is, any combination of colors would be legal). However, from a density balancing point of view, alternating their colors would be preferred, since that would even out the density on both masks. Cell B contains a single polygon in the same layer on which the polygons in Cell A reside. Cell B is placed once over each polygon in Cell A (six times in total). To keep the hierarchy intact, the polygon in Cell B needs to be the same color in every placement. But because it overlaps the polygons in Cell A, all the polygons in Cell A must also be the same color, resulting in an uneven density between masks. You must either sacrifice the hierarchy or sacrifice the density balancing.
Figure 4: Hierarchy vs. density balancing trade-off.
Let’s review the proper expectations for DP processes and results:
- The layout that you draw will be abstracted into a virtual graph to efficiently analyze coloring constraints.
- These virtual graphs do not have spatial or orientation information.
- Although efficient algorithms exist to process this graph information, the long-range nature of DP interactions in a typical layout limit the effectiveness of distributed processing.
- The hierarchical generation, storage, and processing of these graphs means that a variety of coloring results is possible on the same layout, and a particular result is not necessarily repeatable under different operating conditions.
- This variation in coloring result can lead to variation in post-coloring DRC results, and different results are considered equally correct.
- Finding a consistent coloring would require running flat, which is not practical.
- Finding a particular coloring (e.g., for minimizing the post-coloring error count) would require algorithms with exponential runtimes, which is also not practical.
- Coloring should be viewed more like P&R or dummy fill, rather than DRC.
- Hierarchy preservation and density balancing are in direct conflict, so you cannot necessarily have both in any given situation.
Understanding these DP processes, with their limitations and tradeoffs, should help you reset your expectations to better match what you experience, and hopefully relieve some of that confused frustration you’ve been dealing with.
But wait! What about TP and QP? Well, let me just say that you ain’t seen nothing yet. Next time we’ll see what other expectations get blown away in TP and QP. Bring your flak jacket…and an open mind.
Author
David Abercrombie is the advanced physical verification methodology program manager at Mentor Graphics.
Liked this article? Then try this –
This article was originally published on www.semiengineering.com

