Arm, Start, Report – your NVH test results on a count of 3
This was supposed to be a typical “What’s new in Simcenter Testlab 2306 for operational NVH testing” type of blog. Bunch of new features, a nice story of efficiency improvements, and a link to the download page. But as we were busy preparing our measurement setup, a slightly battered off-balance electrical engine, we came to the realization that you only needed 3 clicks between arming the Simcenter SCADAS and visualizing the first result. The number 3 somehow inspired us to think about waltz. Yes, you have read that right, waltz, a type of ballroom dance that is always in triple meter or beat groupings of 3. So without further ado, here’s Simcenter Operational NVH Testing, on a count of 3.
Measure – Process – Report
Kick it off, Herr Strauss!
One, two, three. Arm, record, report. Simplicity, efficiency, and engineering capability, this is what today’s NVH testing users are looking for, and what has been guiding our Simcenter Testlab Neo development. The 2306 release comes with major groundbreaking features. Example? The capability to automatically launch a predefined process once your measurements are done.
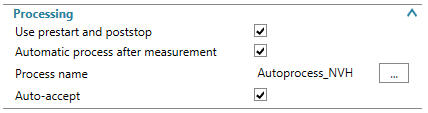
Results are not only processed and stored, but automatically displayed according to the user’s requirements. All this happens in the same worksheet, without any user action. How? Include your predefined process, acquisition settings, and dedicated displays in a project template, and get to the result in no more than 3 steps.
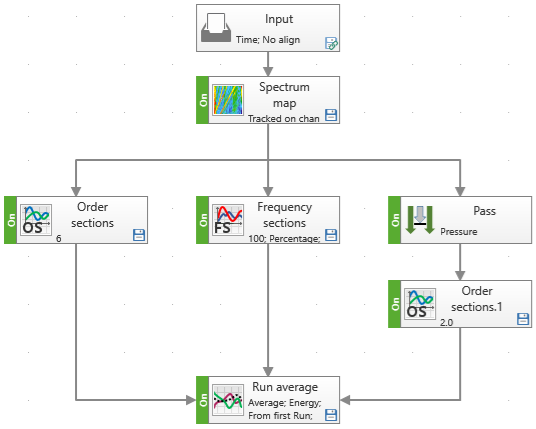
So what’s happening in the video? A template project with a microphone, a tachometer, and a triax accelerometer is loaded, starting directly in the measure worksheet. As we arm the frontend and record: a series of 3 runups is measured according to our defined settings. Once the runups are measured, Simcenter Testlab automatically launches the chosen process. Spectrum maps, frequency sections, mechanical and electrical orders are calculated, and a run average of each single order, as well as an average of the maps, is calculated on the fly.
Last step: report! Our template includes a series of query-based displays that are automatically updated once the data is available.
Reporting
As we’ve mentioned before, it’s best to create a Simcenter Testlab Report upfront. This paragraph highlights the most important steps.
When the data is measured and processed once, you can start to create your report. In a Simcenter Testlab Report, you need to add first the different displays you want, in one or multiple user pictures. A bit like preparing your canvas before painting. Once that is done, you drag and drop the data via the query mechanism to the display. This way you are going to teach the displays which data needs to be shown where. The Simcenter Testlab Report can be saved in a project (.lms), and in a template (.tpl) but you can also save it as a standalone file, a .report file. More details about the Simcenter Testlab Report and queries can be found here.
Afterwards, you start a new measurement and when the raw data is automatically processed, the Simcenter Testlab Report will show/add the new results to your displays.
For a deep dive into the data, you can rely on the new curve scrolling functionality. Based on the query mechanism, you can scroll through your processed and/or measurement results in one Simcenter Testlab Report. The video shows how you can scroll through your project based on run name.
Satisfied with your results? The report can be printed in Office format, with active picture if needed.
An easy-to-miss, yet ridiculously powerful feature added to this release is the ability to align the colors of your curves based on their properties. Note that this is not only limited to reporting – you can do this anywhere in the software! Make sure that all results calculated on a specific accelerometer, or all results coming from a single measurement will always be shown in aligned colors:
The last one for reporting, but one of our personal favorites, is the curve styling. This one goes beyond coloring. You can now impose color, width, pattern, and many more based on the engineering properties of your data. In this example, same as in our video, we’re making sure that the averaged result is always shown as a thick, dashed line, regardless if it’s an FRF, and order or a spectrum.
But wait, there is more
One, two, three: Automatic processing and reporting after measurement, curve scrolling, run averaging of waterfall… But there are many more new functionalities in Simcenter Testlab Neo 2306. Human body vibration, new acoustic metrics and processing options, rpm extraction and tacho functionalities, metadata editing, mode sets visualization… Check below!
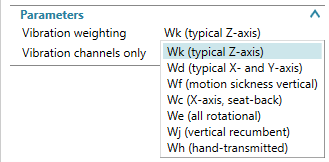
Human Body Vibration
If you are a musician playing a waltz you should normally not worry about the level of vibration going through your hands. But the story is different when you work with a drill or drive a quarry vehicle. Check what is the vibration level according to ISO2631 and ISO5349 with the new methods from the vibration comfort library.
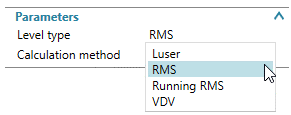
Acoustic level metrics
“You are too loud, we cannot hear each other speaking, please lower the volume of the music!”. That was your neighbor complaining. The good news is that you can evaluate how much this background noise impacts the ability to have a conversation. It is called the Speech Interference Level and is often applied to evaluate how well you can understand a speaker in a vehicle or any other environment. Different SIL methodologies (SIL3, ANSI SIL and PSIL) are available in the new Testlab Neo release. These are not the only acoustic metrics in addition: equivalent continuous sound level (LAeq) and logarithmic measure of sound exposure (LAE) are now available.
Audio replay extensions
What is music without… off-zero order filtering and RPM-profile order filtering..? It might be a stretch to apply the waltz analogy to this extension, but nevertheless, it’s a very powerful way to enhance your NVH analysis of electric, hybrid, and combustion engines.
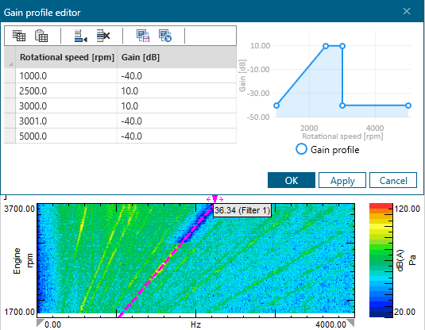
First of all, you can now apply an offset on both the Order pass and Order stop filters in order to focus your attention on those PWM orders:
Secondly, regardless of the offset value, you can now decide to either attenuate or amplify only certain ranges of the order. A very handy graphical dialog will help you to design the most accurate gain profiles.
FRF filtering
Do you want to see how your music transfers to your neighbor? Or more generally, use a predefined transfer function profile to apply to your time trace? Testlab Neo allows to select any FRF to generate a time domain filter. Select the block to be used, define the filter tap number, and share your process with anyone: the settings are kept.
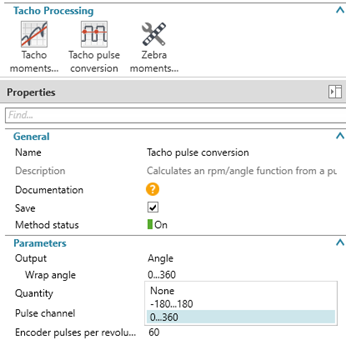
Rpm extraction and angle trace
Turning and waltzing and turning even more! But at which speed? Instrumenting a tachometer is not always easy and can increase your testing time drastically. No need to use a sensor when you can extract the rpm out of any dynamic channel! Use mechanical order or Pulse Width Modulated order to derive your rpm and get your NVH analysis in function of rotational speed. Testlab Neo even allows you to do it for multiple runs at once.
RPM extraction is not the only addition to the rotational domain functionalities. Testlab Neo 2306 offers the possibility to calculate the angle curve instead of rotational speed from any tacho signal. And for better accuracy, we always use the exact timing of the crossing event: the tacho moment. Like on a beat grouping of 3, precision is key.
Order filters in critical band
We did not forget people working on acoustic quality analysis. Order filters can now be defined as order pass or order stop. The bandwidth can be specified in order, frequency line or critical band.
Block as input
A major functionality enhancement in Testlab Neo 2306 is the ability to start processing from spectrum data, orders, overall levels… And not only time traces. It is possible to get the existing order sections from multiple runs of the walzing motor and directly calculate the average, envelope, 3-sigma… or any metrics combination. This makes data transfer and processing faster.
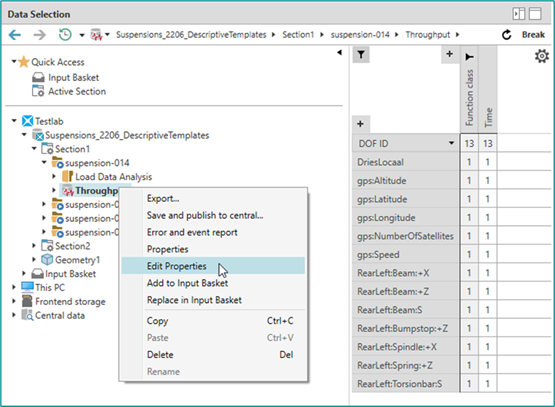
Metadata editor
We all encountered a situation in which we needed to edit some metadata. Simcenter Testlab Neo enables this functionality via the metadata editor. Edited throughput data will be saved in new Run. Edited block data will overwrite original block data. In both cases only a fixed list of properties can be edited.
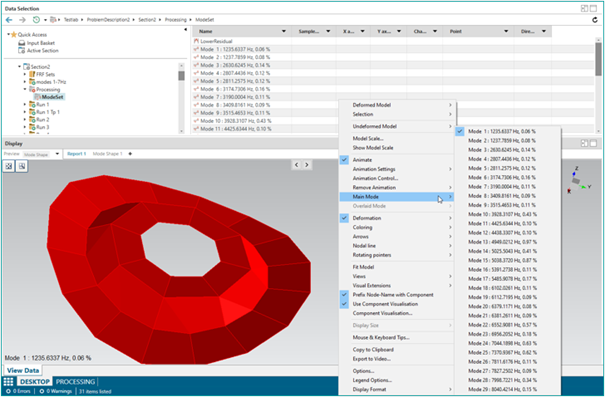
Mode sets in the display
Full-mode sets can now be dragged and dropped into the Geometry display of Simcenter Testlab Neo.
No need anymore to create multiple Geometry displays for each mode shape. You can now easily scroll through modes of (one) mode set(s), to get an overview of the dynamic behavior of the Unit under Test.