Fatigue Simulation of Short Fiber Reinforced Composites
It’s no secret that reducing the weight of materials is key to cutting CO2 emissions – but the question is, how can engineers achieve this? Reducing the weight of components isn’t always easy since structural integrity must be maintained. Random Fiber Reinforced Composites (RFRC) are engineered materials that are especially suited to the creation of lightweight structures. RFRCs are used in almost every type of advanced engineering structure, from all types of aviation devices to marine vessel structures, offshore platforms, automobiles, and civil infrastructures such as bridges or buildings.
Furthermore, the usage of these RFRC composites continues to grow at an impressive rate, as these materials are seeing increased usage both in existing applications and in new markets like biomedical devices and civil construction. So what’s driving the increase in the use and applications of composites? One key factor is the development of new complex forms of material, as well as improvement in manufacturing techniques. For composite structures, due to the local inhomogeneity (lack of uniformity), it is necessary to take the local microstructure into account, as it defines the basic structural behavior. For injection molded short fiber-reinforced composites, the local distribution of the fiber orientation directly influences the (anisotropic) local stiffness of the structure, and it also defines the damage behavior.
In industrial applications in the automotive sector, for example, the lack of durability performance simulation tools restricts the use of more composites in vehicles. As a result, automotive product manufacturers rely on a cumbersome and expensive experimental validation approach to test the durability performance of their designs. Typically, about 20 physical tests are necessary for this purpose. Through a combination of simulation and testing, we help industrial product manufacturers to deliver lighter, stronger, and more durable designs while reducing the number of physical tests (see our previous blog post).
Simulation of durability performance for industrial structural designs is necessary to shorten and reduce cost during product performance optimization (see our previous blog post). The next section describes a streamlined process for doing durability performance simulation of injection-molded short fiber composites.
Simulation Process for durability prediction of short fiber reinforced composites
The durability simulation solution for injection-molded short fiber reinforced composites consists of 3 steps – see Figure 1.
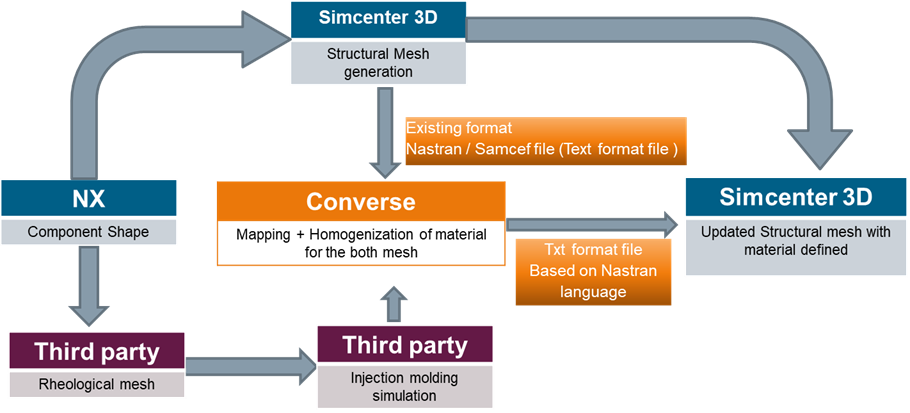
The first step is injection molding simulation with rheological mesh. You can use your existing software with the dedicated mesh tuned for this type of analysis. This provides important information for further analysis – mainly the distribution of the fibers.
The second step is mapping this information to the structural mesh. For this purpose, we use the tool Converse [1] by PART Engineering, which has dedicated mapping techniques available. Short fiber reinforced composites show an anisotropic behavior, caused by the alignment of the fibers during injection molding. This behavior is considered in the proposed simulation process. In the structural simulation, it’s common to assume isotropic material behavior, which can cause designers to apply high safety factors on their design, and may lead to over dimensioning.
The third step is to use the mechanical solver in the multi-attribute simulation environment Simcenter 3D. The most exciting part of the process is using local fiber orientation information in Simcenter 3D and benefitting from all Simcenter 3D attributes for the model preparation and management. After this, you can see the fiber orientation in each finite element in every direction for structural analysis and durability solvers in Simcenter 3D!
The final analysis is a durability simulation method – the Master SN Curve approach [2]. (An SN curve is a plot of the magnitude of alternating stress versus the number of cycles to failure for a given material.) The general idea of the Master SN Curve approach is to separate the effects of the orientation from those of the material (including temperature, humidity, etc.). By including the effect of fiber-matrix debonding and fiber failure on a micro-level, the approach models the effects of the fiber orientation, base material, and environmental factors [2].
Atul Jain developed the Master SN Curve approach [2] in the scope of his VLAIO (Flemish government agency Flanders Innovation & Entrepreneurship) Baekeland Ph.D. project “CompFat”, with Siemens Digital Industries Software, KU Leuven MTM (Department of Materials Engineering), and Ghent University. The goal of the project was to predict the fatigue behavior of RFRC. In the context of the ICON (research and industrial based project) project “ModelSteelComp”, the method has been extended to handle curved fibers, and the feedback loop implementation has been made that allows running the FE solver and durability solver together. ModelSteelComp is an R&D project completed in Flanders, as a part of the NANOFORCE program funded by SIM Flanders and VLAIO, with several academic (KU Leuven) and industrial (Siemens Digital Industries Software and Bekaert) partners. The aim of this project was to develop, implement and validate methodologies for the mechanics (static and dynamic/fatigue) of random fiber-reinforced composites.
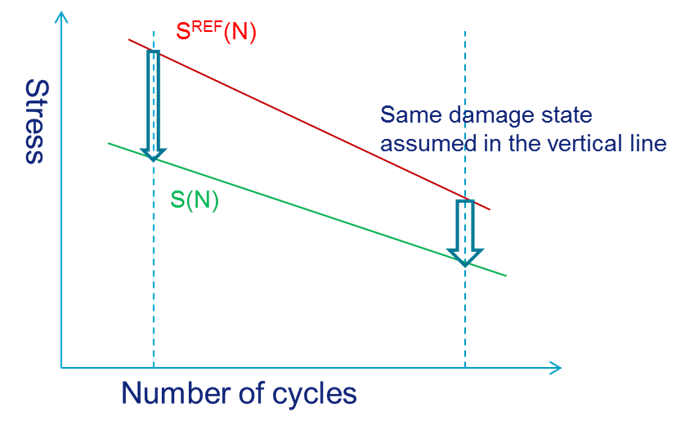
In the Master SN Curve approach, you start with an SN curve for a given orientation. From this SN curve, you then read the stress amplitude for a reference life (for high cycle fatigue it is about 10,000, 100,000, or a million cycles). Then, the damage from this stress level is calculated on a microscopic level. Then for the target fiber orientation, iterate the applied stress amplitude until you have exactly the same damage. Consequently, we know the damage that corresponds to the stress on the material volume, for a given orientation. This information is then used to shift the Master SN curve. The described procedure is repeated for multiple points to account for a change in the slope of the SN curve.
After the project, Siemens Digital Industries Software implemented the Master SN Curve methodology into Simcenter 3D to enable their software for durability simulation for structural parts in a unified, scalable, open, and extensible environment for multi-attribute 3D CAE. The methodology and workflow have been extended to also cover plasticity and high-temperature conditions, in order to deal with real-life industrial use cases.
Result for oil filter system under pressure and elevated temperature
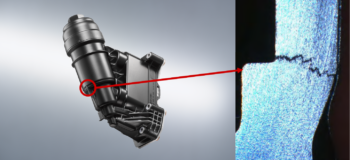
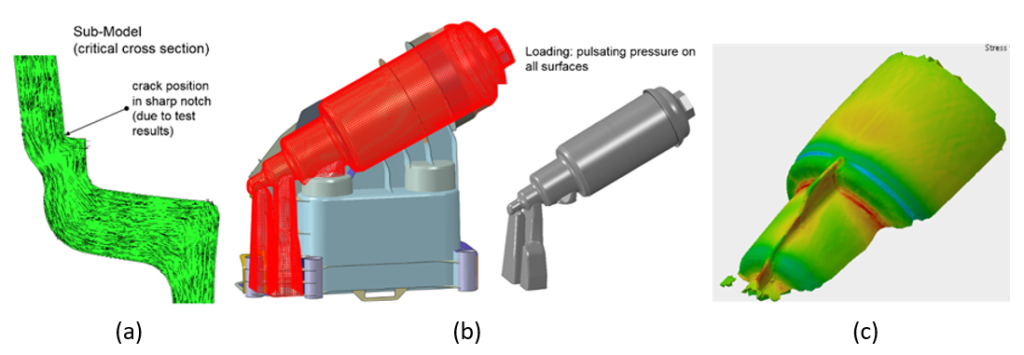
In this final section, we will show durability simulation results for an industrial short fiber-reinforced composite structure from the automotive industry – an oil-filter system from MANN+HUMMEL, subject to 150 °C under pulsating pressure load [3].
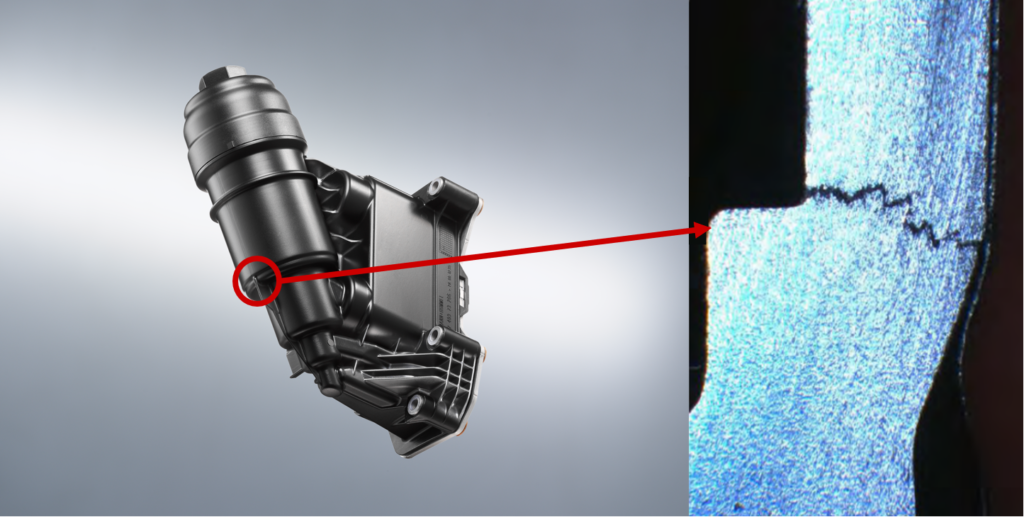
As a first step in the required CAE process chain, injection molding must be simulated. This is in order to obtain the local orientation tensor. Figure 4a shows the fiber orientation in the critical area of the component. You should map the fiber orientation from the manufacturing simulation model onto the structural simulation model. It is likely that both models use a different mesh topology. As a result, in this situation, you should apply the software Converse [1]. This provides not only the local orientation tensor but also a full set of anisotropic material properties if requested. Then you can perform finite element analysis. Since the Master SN Curve approach uses automatic stiffness reduction, the finite element calculation uses the internal finite element solver (Simcenter Samcef). A result in the critical area is shown in Figure 4c .
The next step for fatigue analysis is the calculation of the SN curves for all orientations in the model, starting from a Master SN curve at the elevated temperature of the oil filter. As we encounter high plastic stresses, you can use a Neuber type approach in Simcenter 3D, which deals with elevated temperatures and large strains on plastic. Then the master SN curve is taken at the elevated temperature. Now with the SN curves for all orientations, the full lifetime of the component can be simulated. See two states of the damage accumulation and stiffness reduction over time in Figure 5, where a high stiffness reduction in the notch leads to stress redistribution.
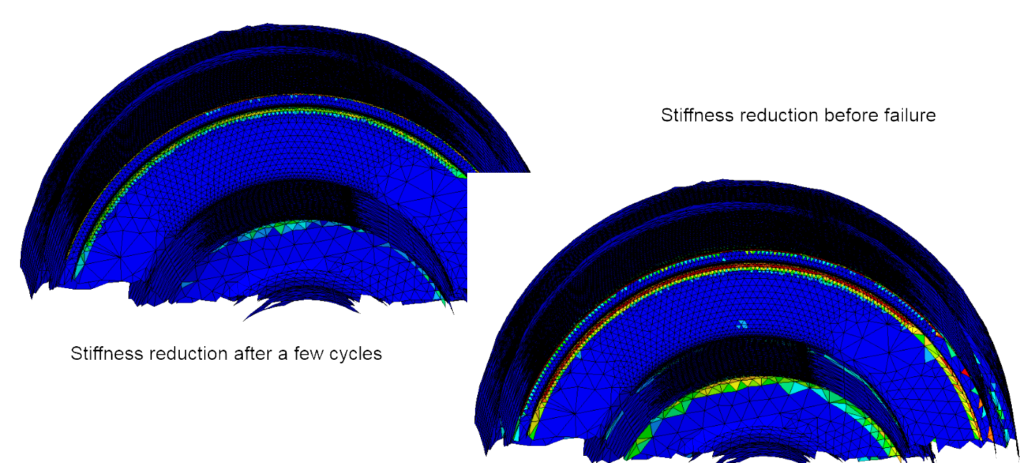
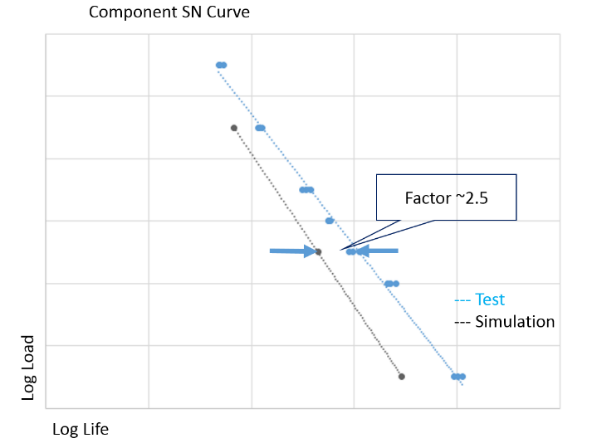
Figure 6 shows the test results versus simulation results at 3 different load levels. The simulation is slightly conservative, underestimating the actual fatigue life. The new method predicts the lifetime (and damaged area) as well as correct component behavior. It can do this even for high loads, and therefore high plasticity.
More info?
If you’re looking for more information, it is recommended to read this white paper “Predict fatigue life for additive manufacturing with Simcenter 3D”. It reports an important step forward in using machine learning to predict the local fatigue properties to feed our durability calculation in Simcenter 3D. It also presents a novel strategy that will allow manufacturers to print durable parts much faster and cheaper.
Acknowledgements
The work leading to this publication has been funded by the projects “CompFat” and “ModelSteelComp”. The “CompFat” project was conducted by Dr. Atul Jain as a Baekeland Ph.D. trajectory funded by VLAIO (Flemish government agency Flanders Innovation & Entrepreneurship), with industrial partner Siemens Digital Industries Software and academic promoters KU Leuven MTM and Ghent University. The project “ModelSteelComp” fits in the SIM NANOFORCE research program, coordinated by Bekaert (Belgium, until 2015) and ABV (Belgium, since 2016), and has been funded by SIM (Strategic Initiative Materials in Flanders) and VLAIO.
References:
[1] PART Engineering GmbH, “Converse – Software for Simulation Plastic Parts”, User Manual, Bergisch Gladbach, Germany, 2019.
[2] A. Jain, W. Van Paepegem, I. Verpoest, S.V. Lomov, A feasibility study of the Master SN curve approach for short fiber reinforced composites, I.J. Fatigue, 91(1), 2016, pp 264-274.
[3] M. Hack, W. Korte, S. Straesser, M. Teschner, “Fatigue simulation of a short fiber reinforced oil-filter under high temperature and pressure load”, Procedia Engineering, Volume 213, 2018, pp. 207-214.


Comments
Comments are closed.