Ensuring safety in AD/ADAS systems: 3 keys to avoid getting flooded by your data
By David Boyker, IVEX
For car manufacturers, ensuring that AD/ADAS systems are safe requires collecting a lot of data. To develop, validate and improve autonomous systems, the process is often the same: iteratively make them drive in various conditions and for many kilometers. The driving logs, which come from different sources (camera, GPS, Lidar, simulation, etc.), are then processed and analyzed to find ways to improve the systems’ safety and performance. With a lot of sensors, many different use cases, and a huge number of kilometers driven, the the amount of information to process can quickly grow exponentially.
With such an amount of information to handle, it is easy to get overwhelmed. A lot of elements collected can be useless (think about all the kilometers driven where nothing interesting happens) and some parts of it could be lost or broken in the process. In addition, collecting data isn’t sufficient. It needs to be managed, interpreted, and correctly analyzed. The bigger the data pool, the more painful and costly can be.
There are 3 keys, or fundamental principles, to avoid getting submerged by the data and being able to benefit the most from it.
- Focus on relevant findings by using metrics and algorithms
- Represent knowledge with comprehensive visualization tools
- Rely on a suitable and scalable architecture
Read more about these 3 keys and discover some examples of how it is related to IVEX and Siemens AD/ADAS solutions.
Key #1 – Focus on relevant findings by using metrics and algorithms
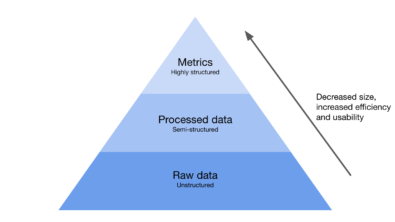
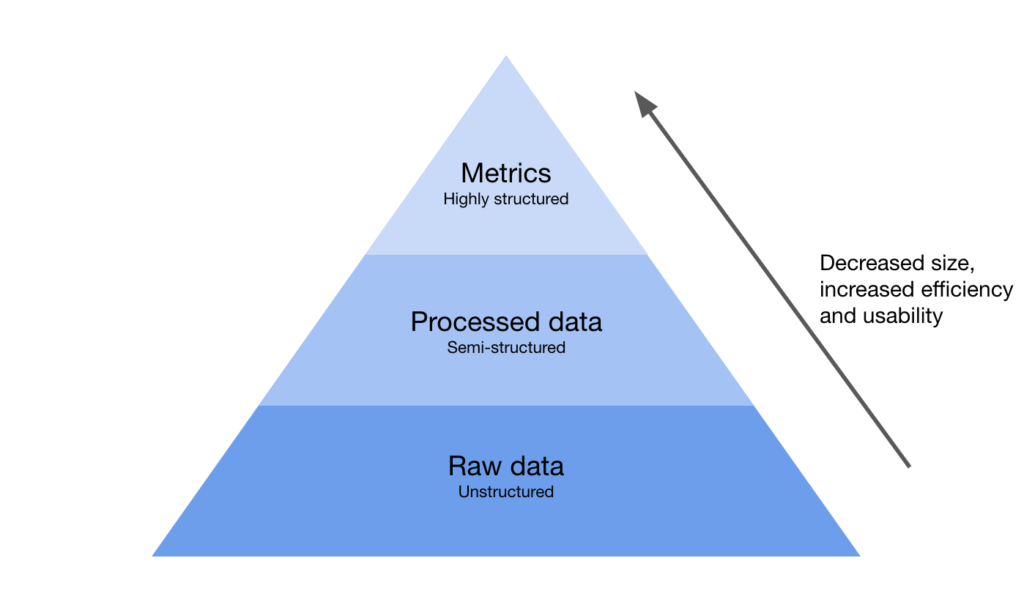
The first key relies on a simple principle: the data pool must be reduced as much as possible, by keeping only the most pertinent information. The less content there is, the faster it is to process and analyze. In addition, focusing on smaller sets of knowledge reduces the storage cost and the maintenance burden.
To reduce your initial pool of content, the idea is to create chunks of useful information, or “metrics”, which summarize and describe it in a shorter and more meaningful manner. These metrics can refer to several things depending on the use case: statistics, events, or even scenarios. Once they are defined in alignment with the business needs, they must be generated by appropriate algorithms.
Imagine that you are a company trying to improve the safety and comfort of your new vehicle. Specifically, you are trying to understand how to reduce the situations where the vehicle is performing dangerous hard braking; i.e. situations in which the vehicle brakes abruptly, creating discomfort for the user(s) and a potential safety hazard. Instead of manually inspecting the historical driving logs in the hope of finding these situations, it is more appropriate to build an algorithm that will do the job. An example of an algorithm could iterate over the driving measurements, compute the deceleration of the vehicle, and tag the moments in which it is above your defined comfort limit. In addition, the algorithm could compute extra parameters, such as the distance to other vehicles, which would allow an understanding of why it happened. Once the initial data is tagged with the selected metrics, you can focus your effort on them.
If you want to read more about how IVEX categorizes interesting scenarios or discover the SIEMENS-IVEX white paper on relevant safety metrics, you can check out the following resources:
Key #2 – Represent knowledge with comprehensive visualization tools
Once the first key is applied, the initial raw pool of data is condensed into small pieces of pertinent content. They need to be visualized, analyzed, and shared, so they can be useful for the development or validation of new vehicles, sensors, or software. All of these can be done by connecting the findings to a powerful analytics platform. It is a centralized place where all the selected metrics are summarized and where it is possible to control the information flow. Depending on the context, there are many examples of visual inspection: analyzing near collisions on a map, extracting cut-in scenarios on a time-series plot, visualizing vanishing objects on camera images, etc. Useful visualization also facilitates analysis and allows the generation of reports that can be shared across teams or any involved stakeholders.
To illustrate this, let’s continue with the safety and comfort example that is described in the previous section. Once all the interesting hard braking situations in your initial driving log are found, it is possible to understand how, and most importantly why, they happened. One solution might be to display the situations on a map and plot the info of the concerned vehicle and the surrounding obstacles. The findings can then be passed to the relevant teams, in order to improve the system.
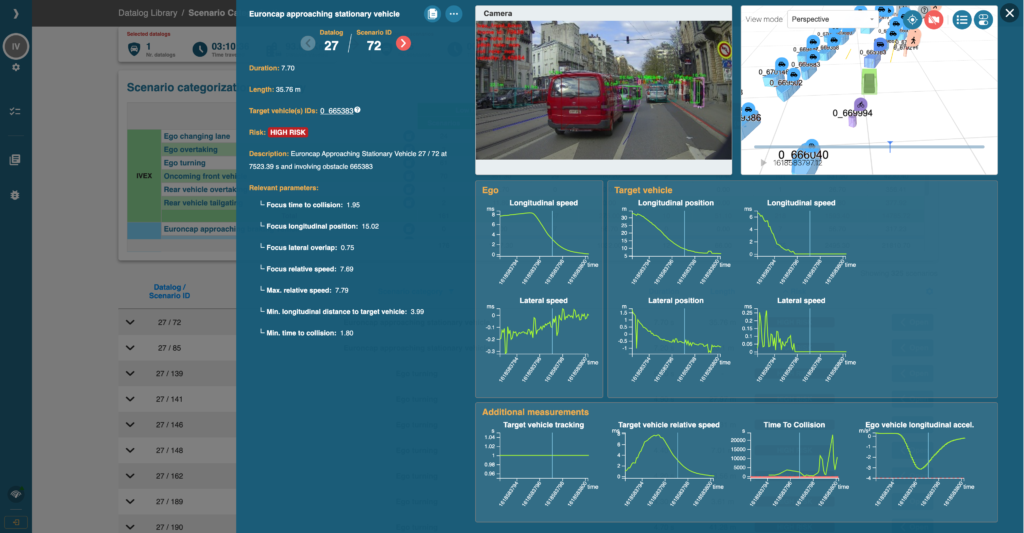
Both Siemens and IVEX provide the right tools to help visualize complex real-world or simulated driving logs. Some examples can be found below:
Key #3 – Rely on a suitable and scalable architecture
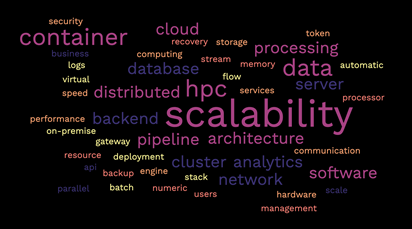
The previous keys tell us that, to benefit the most from the collected data, it is needed to reduce it into useful metrics, and then display them on a powerful analysis tool that allows easy visualization and sharing. This can only be achieved with a suitable architecture. This latter is the cornerstone of the processing pipeline, which allows the algorithms and the tools to run smoothly.
Many existing technologies exist to support the collection and analysis of a large amount of information. They are the backbone of Siemens and IVEX software and also allow the pipelines to scale smoothly. A good example can be seen here, where a scalable architecture is used in Simcenter Prescan.
If you want to learn more about these 3 keys, and discover how properly handling driving logs can help foster the development and validation of AD/ADAS systems, you can read more on Siemens website or IVEX medium. The Siemens-IVEX white paper on safety metrics can be accessed here: white paper.
About IVEX
IVEX is an international team working on extremely challenging and interesting technical problems that have a huge societal impact. IVEX’s unique IP and team experience in behavior planning, functional safety, and vehicle engineering enable the development of safe autonomous vehicles https://www.ivex.ai/.