Simcenter FLOEFD: CFD for Design-Engineers – Part 4
This is Part 4 of a 4-part series explaining the technology behind Simcenter FLOEFD. Here I will aim to demonstrate the accuracy and consistency of the enhanced turbulence model in Simcenter FLOEFD, in an automotive aerodynamics application, compared against a host of turbulence models offered by conventional CFD. Part 1 introduced some of the main technologies that make CFD available to designers with specific examples in Parts 2 & 3 (links to the previous posts provided at the end of Part 4).
Benchmarking turbulence models in automotive aerodynamics
As it is with any new CFD project, making sure that you are able to reliably predict the behavior or performance of the real-world application requires benchmarking a CFD model against well documented experiments (or at the very least trustworthy CFD results) of a similar application, which you can then transfer to the actual model and hopefully produce believable results. For some sound advice on how to compare CFD results (the correct way), have a look at this blog post written by my colleague Boris Marovic.
Any CFD benchmark pertaining to automotive aerodynamics starts with the Ahmed’s body as defined by Ahmed, S. R., (1984)[1]. This study, provides extensive experimental data on the Ahmed’s body in the form of a breakdown of the total drag into the various portions of the body and their respective partial drag contributions. It is understandable then that these data are frequently used to validate or benchmark turbulence models in the automotive aerodynamics. Therefore I set out to conduct my own validation of Simcenter FLOEFD against the Ahmed’s body data. However, I also compare my results with that of Beneke (2018)[2] to see how Simcenter FLOEFD’s turbulence modelling and boundary layer calculations perform against those that conventional CFD has to offer.
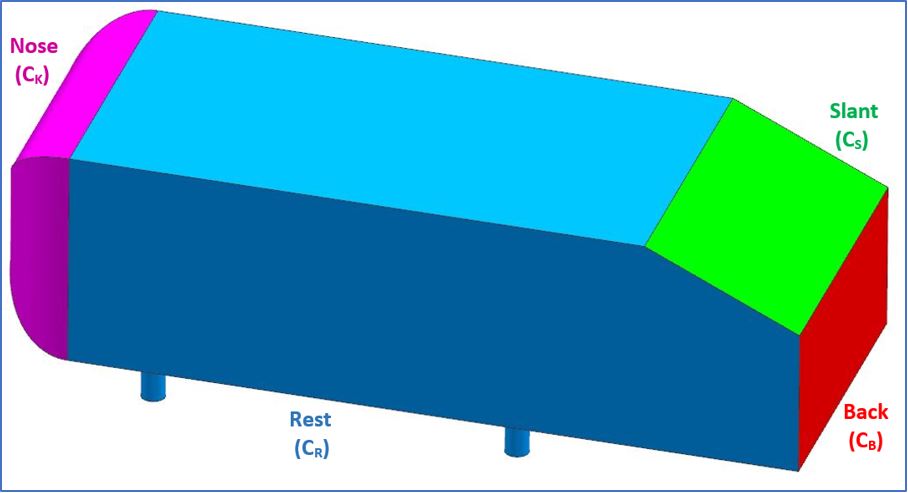
The CAD model of the Ahmed’s body is shown in Figure 1 (symmetry was also applied). After doing a rather extensive mesh dependence study to obtain the mesh independent result (roughly 11 million cells), an attempt was made to find the minimum mesh size that could still produce the same level of accuracy as the mesh independent results.
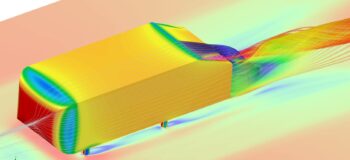
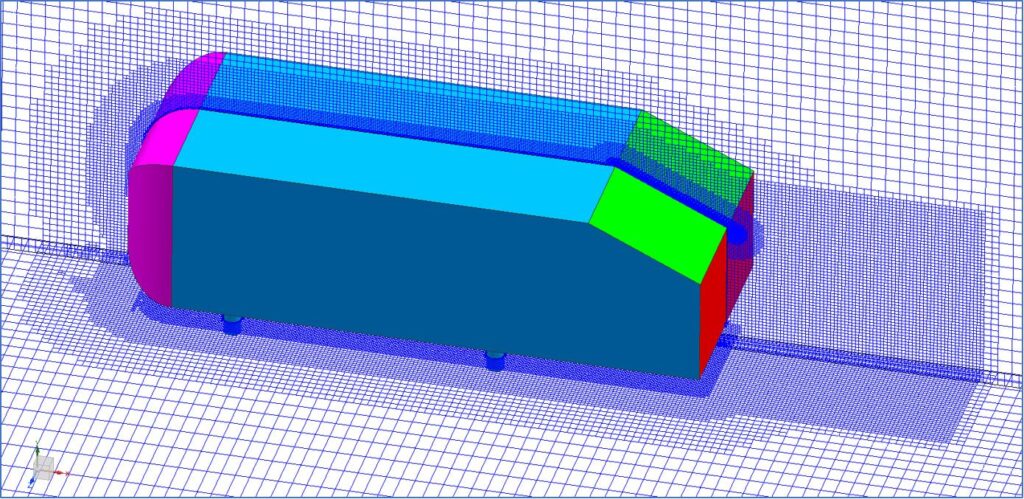
The areas of mesh refinements that had the biggest influence on the results were identified and the mesh was focused in these areas i.e. underneath the body, over the slant and in the wake. In the other surrounding areas the mesh was made as coarse as possible, resulting in a minimum mesh size of approximately 5.5 million cells, see the resulting mesh in Figure 2. Capturing the flow underneath the body is hugely important, but more so for predicting the lift accurately rather than just the total drag. Let us look at the drag and lift results in more detail.
Results: Drag
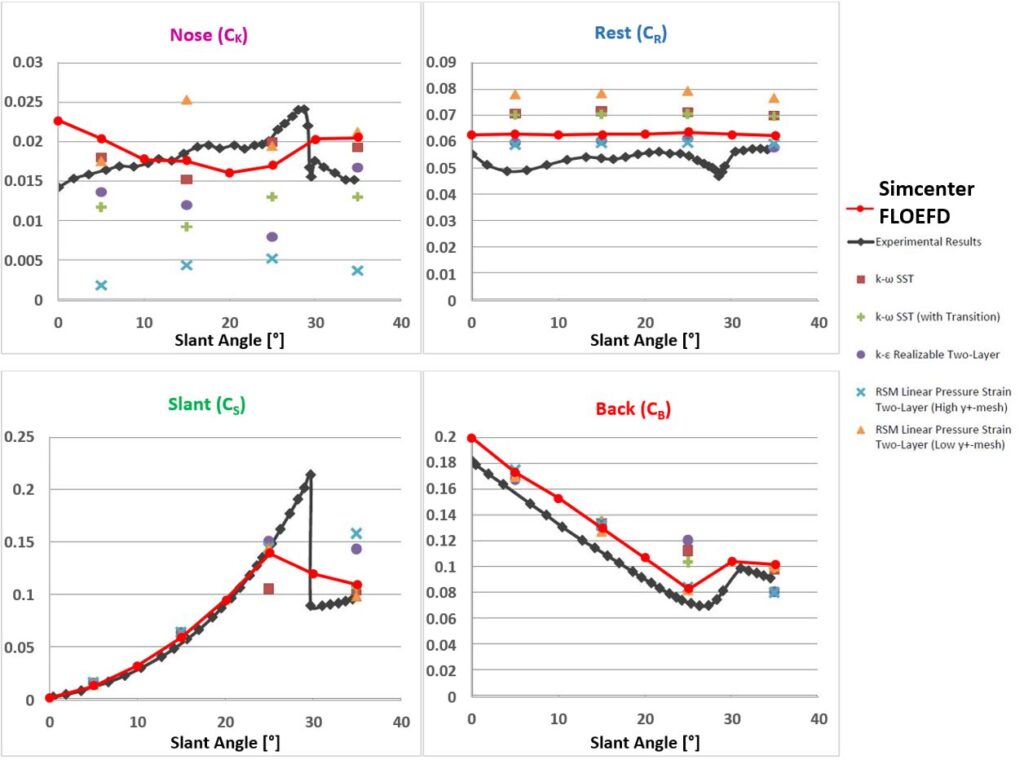
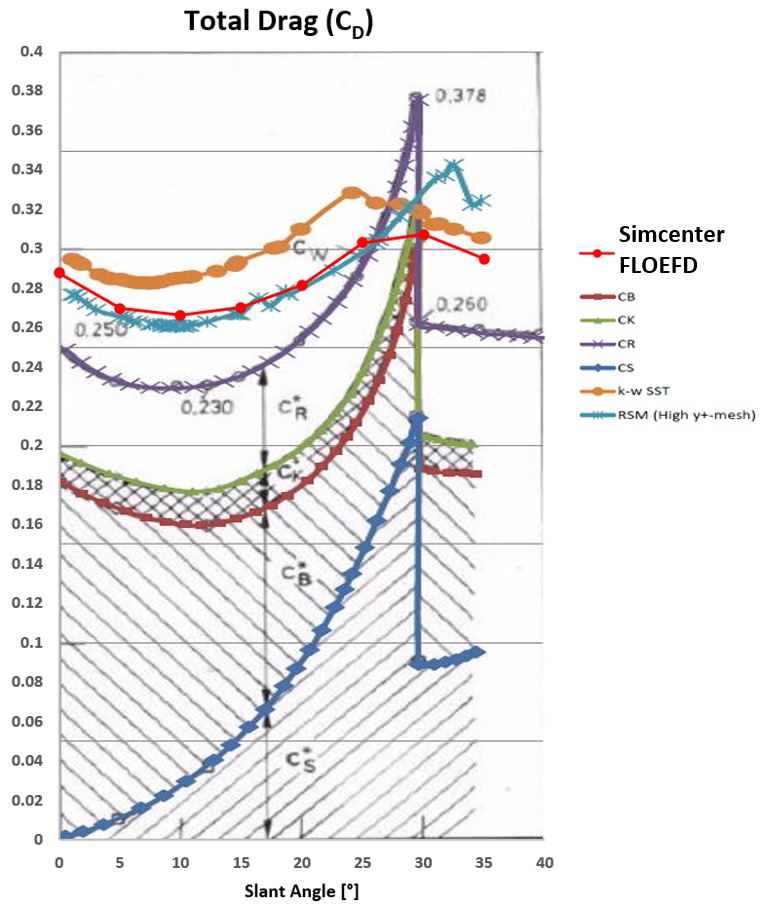
A series of simulations were run by varying the slant angle in increments of 5 degrees from 0 to 35 degrees. The drag on the various portions of the body (Figure 3) as well as the combined total drag (Figure 4) are compared to the experimental data from Ahmed, et al. (1984) along with the results from a wide range of turbulence models produced by Beneke (2018). Looking at the comparison it is immediately evident that the Simcenter FLOEFD results are among the best of the different turbulence models and generally more consistent with the experimental data across the range of slant angles regardless of the different portions of the body, where different turbulence models produce different results.
Note how Simcenter FLOEFD performs in the drag predictions of the nose (CK) and rest (CR) compared to the scatter produced by the range of alternative turbulence models. But the nose and “rest” of the body combined only contribute 25% towards the total drag. Thus, let us rather focus our attention on the main drag contributing portions of the body, i.e. the slant (CS) and the back face (CB). For the slant Simcenter FLOEFD performs well up to a slant angle of 25° along with all the other turbulence models (RANS turbulence models struggle to predict the high peak in drag coefficient up to 30°, before the sudden drop due to complete flow separation). However, beyond 30°, at 35° slant angle, the Simcenter FLOEFD result is again consistent in its predictions and among the best of the turbulence models. Interestingly at 35° it is the RSM High y+ and Realizable k-ε models which performed best in the CR predictions, that are now the furthest off from all the models. Moving on to the back face it is noteworthy that Simcenter FLOEFD is the only result consistent with experiments across the entire range of slant angles, where the k-ε and k-ω SST models are the furthest off at the 25° angle, but at 35° the RSM High y+ and Realizable k-ε models are in turn the furthest off and now even below the experimental data.
Finally, looking at the graph of the total drag versus slant angle in Figure 4, one can again see the difference in results between the k-ω SST and RSM High y+ before and after the abrupt change in drag at 30°. Comparing the Simcenter FLOEFD predictions one can see that before 30° the RSM High y+ and Simcenter FLOEFD results lie closest to the experiments and beyond 30° the k-ω SST and Simcenter FLOEFD results in turn lie closest to the experiments. So, it seems evident that Simcenter FLOEFD is quite capable of predicting the drag accurately, but what about lift?
Results: Lift
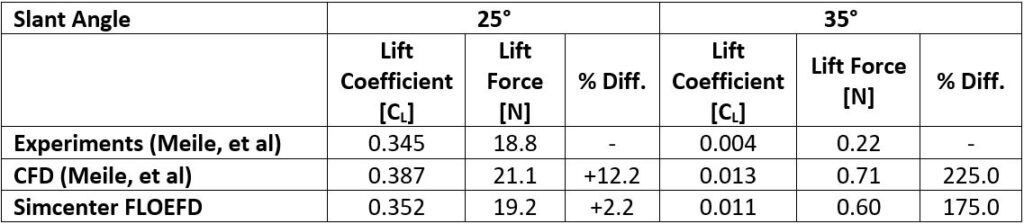
Ahmed, et al. (1984) only considered the drag on the body (from what I could gather). Fortunately, there is another study by Meile, et al. (2011)[3] that measured the lift and drag at slant angles of 25° and 35°. CFD simulations were also conducted in their study and are added as reference to Table 1 below. Just to get back to my comment earlier, the results presented for the drag coefficients were obtained with the same mesh which was consciously refined for accurate lift predictions as well. See the comparison of the lift coefficient predicted by Simcenter FLOEFD as compared to Meile, et al. (2011), in Table 1. At the 25° slant, Simcenter FLOEFD predicts the lift very accurately. At 35° Simcenter FLOEFD over-predicts the lift (as did Meile, et al.), but the measured lift is so small that the percentage difference can easily look excessive, but if one considers the absolute lift force value, then the difference is 0.6 N versus 0.22 N, which is effectively zero lift when compared to almost 20 N lift for the 25° case.
Be that as it may, these results prove Simcenter FLOEFD also to be very capable of predicting the lift accurately as well, despite the challenge of solving flows underneath bodies with close proximity to the ground. Because of the complex interaction of different flow behavior, i.e. flow over and underneath a vehicle in the same solution domain, selecting the correct turbulence models in automotive aerodynamics is no feeble task. There are numerous benchmarks available, but one such study conducted by the JSAE (Japanese Society for Automotive Engineers) should be proof enough of that fact.
Conclusion
It is exactly these observations that make CFD so challenging in general. With turbulence models it is not a case of what is good for the goose is good for the gander. It can happen often during design changes that the model changes in such a way that the flow behavior can be sufficiently different to cause inconsistent predictions from one design change to the next (or cause solver/convergences problems).
Typically, CFD users would have to find the trade-off between the different turbulence models to implement the one that gives the best results overall, or at least accurately capturing the most dominant flow behavior or integral parameter of interest, sacrificing accuracy in other areas. Whereas Simcenter FLOEFD can quite easily strike that perfect balance that allows you to run through your design iterations reliably, efficiently and confidently. Thus, considering the accuracy and consistency of the enhanced turbulence model in Simcenter FLOEFD, it is evident why it can be very effectively applied by design-engineers.
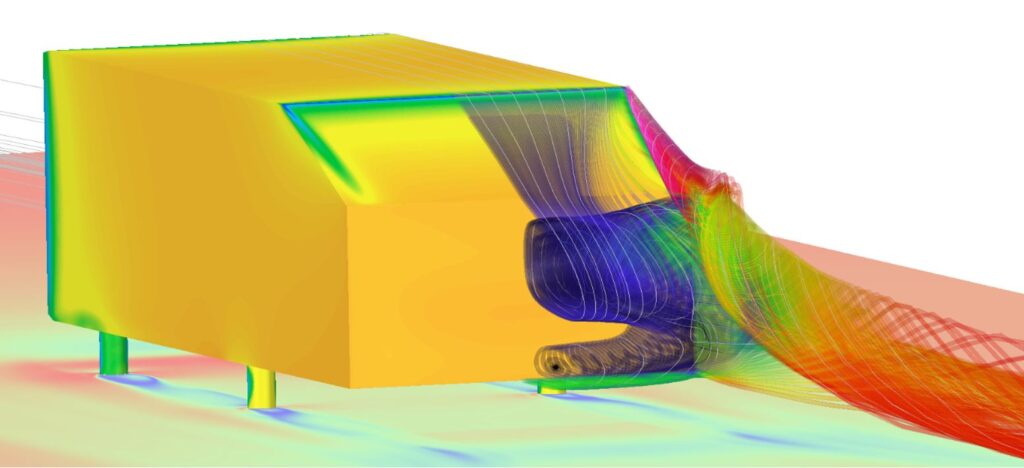
I will end this series by stating that Simcenter FLOEFD is first and foremost about getting those practical engineering tasks done quickly and efficiently. It is not all about making “pretty pictures”, but whenever there is time, why not make a few…?
Thank you for reading, see the links to the previous posts below.
Part 1: The Technology behind CFD for design-engineers
Part 2: Design and optimization of a flue-gas stack (Example of Simcenter FLOEFD for the Design)
Part 4: Benchmarking the enhanced turbulence model in Simcenter FLOEFD for automotive aerodynamics
References
[1] S. R. Ahmed, G. Ramm and G. Faltin., Some Salient Features of the Time -Averaged Ground Vehicle Wake, SAE Paper, 1984.
[2] A. Beneke., The Simultaneous Optimization of the Nose and Tail Geometry of a High-speed Train for Drag and Crosswind Stability, Master of Engineering Thesis, University of Pretoria, 2018.
[3] Meile, W., Brenn, G., Reppenhagen, A., Lechner, B., Fuchs, A., Experiments and numerical simulations on the aerodynamics of the Ahmed body, CFD Letters, Vol. 3, 2011.


