No room for extra weight nor risk: just test it right with Simcenter Testlab Neo Mission Synthesis

In June 1915 a young Edsel Ford (future president of the Ford Motor Company and Henry’s son) decided to do something that at time was simply astonishing: driving a 1915 Ford Model T, the first mass produced affordable car, across the country from Detroit to San Francisco using the infrastructure available at the time. They wanted to demonstrate the durability of the vehicle and promote the car as a reliable means of long-distance transportation.
How did they manage to get to San Francisco without having the harsh shock and vibrations of the roads (back then just a bit more than trails) ripping apart the Model T? The trip was certainly a success in terms of echo and awareness for the auto industry, but at the time durability was not yet a well-established discipline: the car just needed to make it until the end… somehow.
The Model T’s parts and components were certainly not designed (yet!) for that type of mission; many failed during the trip and needed to be replaced with a scheduled frequency (repair stops were part of the itinerary) as shown below.
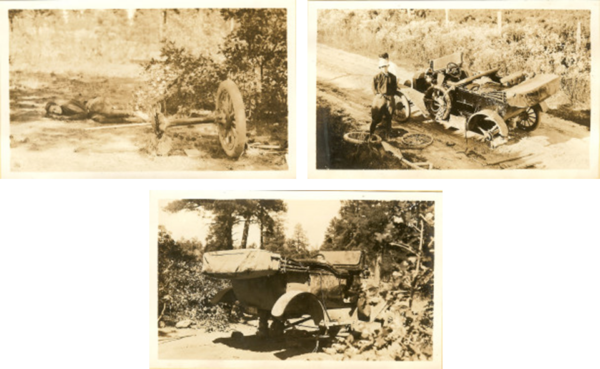
Next to the need for a better highway system (and the need for many more gas station along the road), the trip of Edsel Ford and friends brought back another very important lesson learned: harsh shock and vibration conditions need to be taken into account when designing a vehicle for a specific known mission.
More than 100 years later, the automotive and transportation industry is going through another revolution. Electric vehicles and hydrogen-powered cars are not blueprints anymore, but are part of our daily life. EV owners today have a primary need, considering that a high-end EV car has a range not too far from the one of the early model T (approximately 350 km): more milage, more milage, more milage (and a bit of extra trunk space will not harm either!).
This can be achieved by reducing the weight of the car, of course, stripping down the mainframe and designing light brackets and simpler electronical components. But then we would again sacrifice robustness against shock and vibrations.
Where is the sweet spot?
Durability testing
The main goal of shock and vibration testing for durability applications is to accurately replicate in the laboratory the vibration input to any critical component, a.k.a. a Device Under Test (DUT, for example a battery cell mounted on a EV car), such that it will survive a desired mission.
Just as an example, we can imagine that the mission for the components mounted on Edsel’s Ford Model T’s may have looked like the one sketched below.
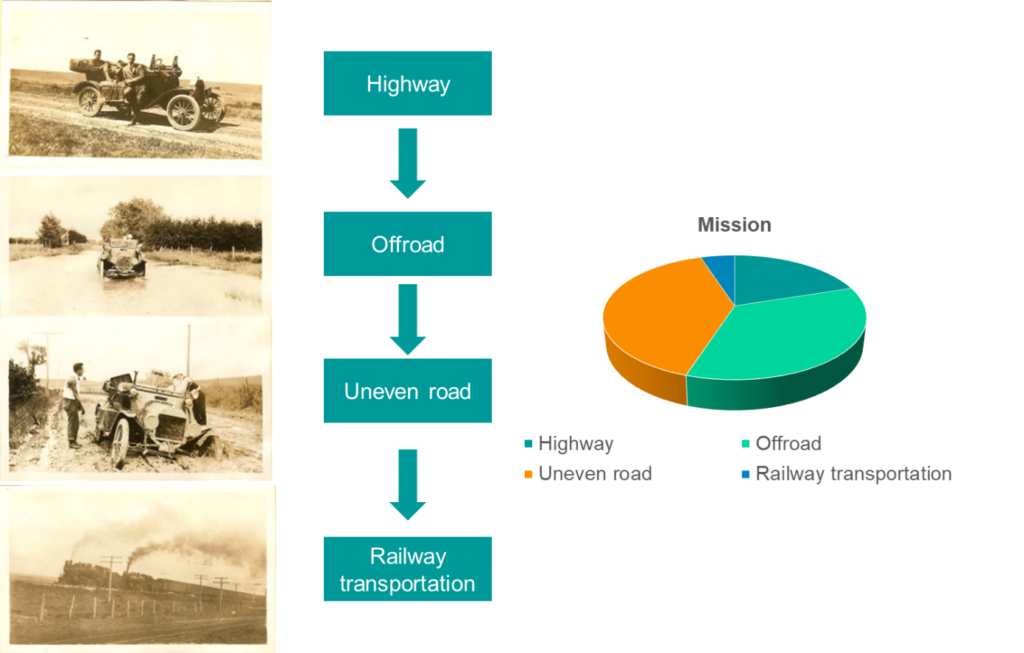
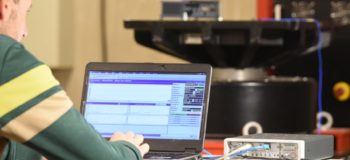
These events, and ultimately the entire mission, are associated with vibration tests reference profiles. Testing can be performed strapping the DUT on a shaker and adopting Simcenter SCADAS Shock and Vibration Testing products to drive the shaker with the voltage required to match these profiles.
Over the years, standardization committees and organizations (such as the Institute of Environmental Sciences and Technology, IEST) contributed to the development of a large body of standardized breakpoint profiles that can be used to test a DUT with a known intended use. Just as an example, the next picture shows random vibration references (PSD’s) coming from different standards together with a PSD calculated from actual measurements. This snapshot shows already an interesting point: the standardized curves are probably meant to envelope the measurements quite artificially.
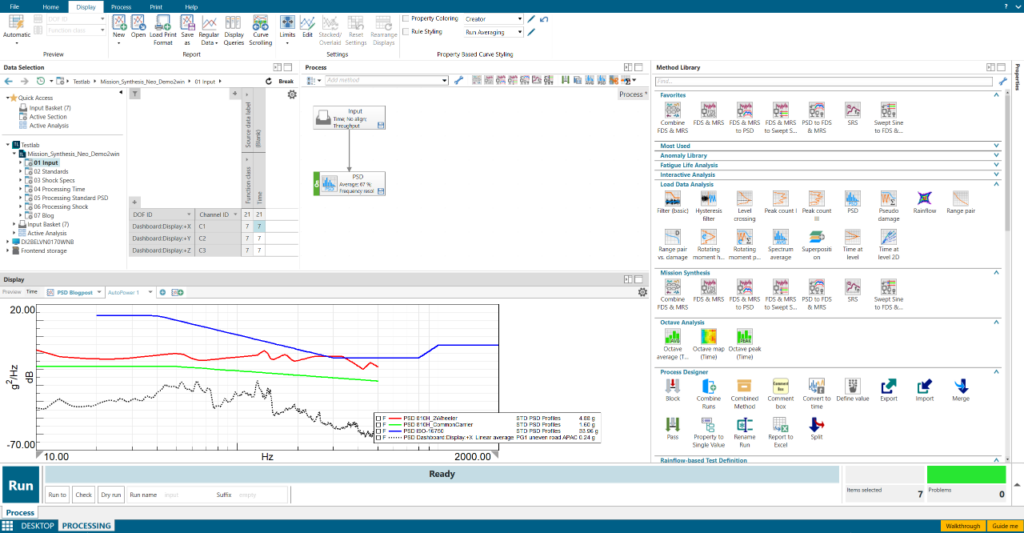
Nevertheless, shock and vibration testing engineers are often obsessed with the goal of “meeting the specs”. As often it is however overlooked what these curves actually mean and how would they compare with the actual mission for the DUT.
In theory, the left plot of the figure below shows what a correct test spec and DUT design should aim to. The test levels should be slightly above the extreme uses in the mission so that potential in-service failures are covered by the test and the (over-)testing margin is kept to a bare minimum. The figure also shows two extreme, yet not uncommon cases: large overtesting margin (top right) and undertesting (bottom right).
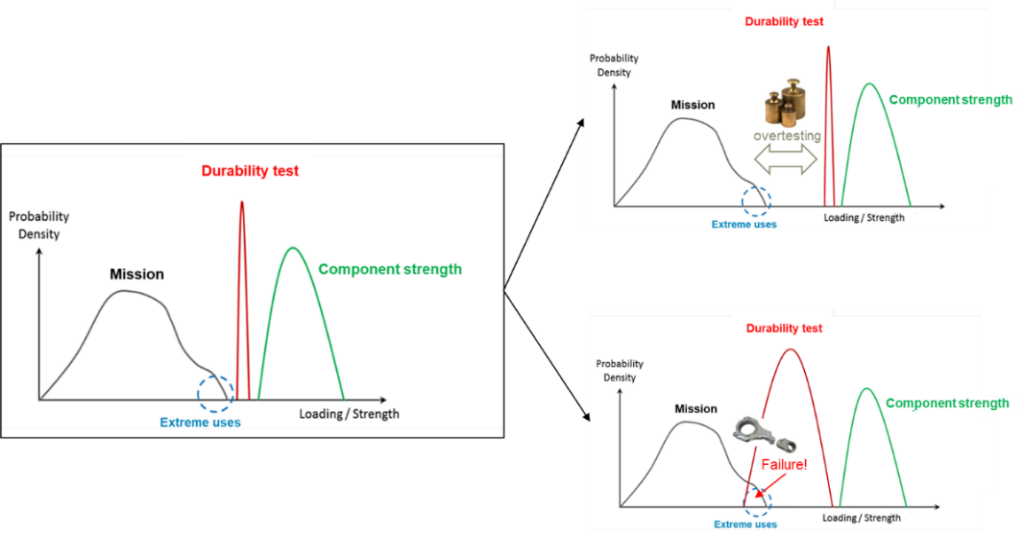
Clearly, undertesting must be avoided at all costs, because it can result in poor quality products and the risk of field failure for the device (and perhaps the vehicle). The resulting risk for the user of the device is, understandably, unacceptable. Because of this fear of in-service failure, there has been the historical tendency to adopt standardized test profiles with significant overtesting margins implicitly included. This approach can be generally safer for a company reputation, but the price to pay is an overall oversizing of the designed DUT which can lead to the paradox of design for testing.
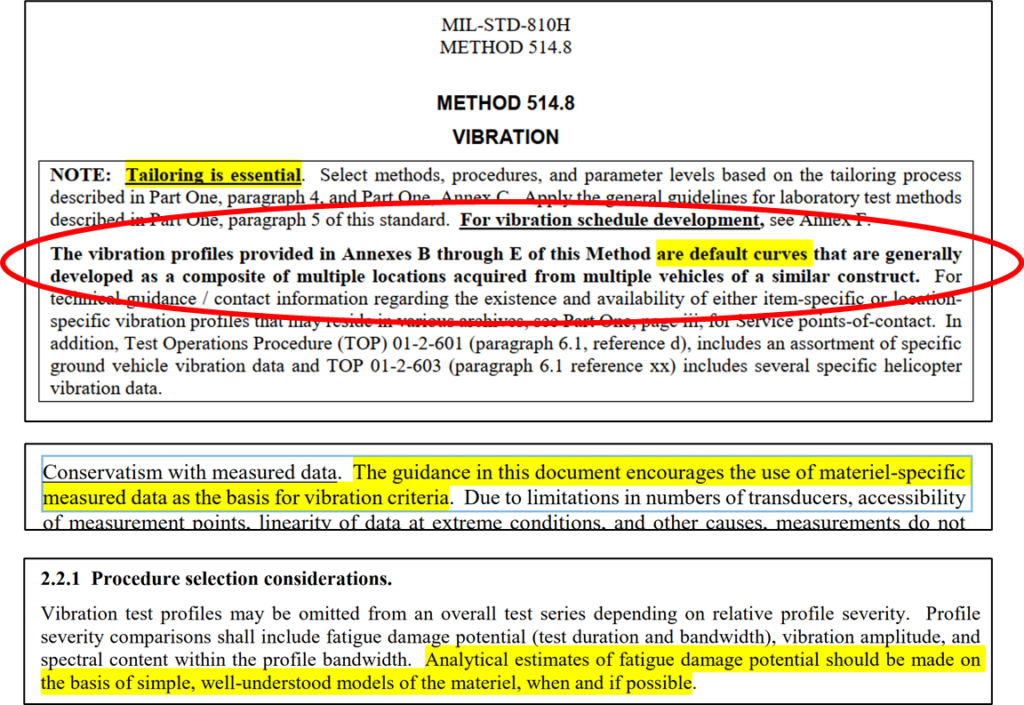
Next to this, the adoption of standardized test profiles assumes that the legacy data and margins adopted for the definition of the specs (sometimes decades-old!) also apply for an application-specific DUT that needs to be designed and tested today. But does it? The answer is a dangerous “maybe not”. These standardized curves need to be taken with care, as also mentioned at the very beginning of the MIL-STD 810H, Method 514 (Vibration), see below.
We shake as hard as we can, for as long as specified, although the replicated vibrations will never be encountered by the DUT. And we still take a certain risk.
In turn this means more weight, lower performances, less milage, bigger battery packs, less trunk space and fingers still crossed. All good reasons to try to test better and approach the optimum. Looking at at the picture below, I think that Ford’s co-driver Thomas Whitehead would have probably agreed.

How to test better: test tailoring
Test tailoring is the approach for testing better. It can be loosely defined as the specification of the right vibration test procedure for a device that will be exposed to known extreme vibrations loads. This includes selecting the right test sequence, but especially adopting representative test specifications that are brewed starting from available time data.
So… how can we derive better specifications from time data that replace the very general standardized profiles? In Simcenter Testlab 2406 we provide an answer to this question with the integration of Mission Synthesis in Simcenter Testlab Neo Process Designer.
Mission Synthesis
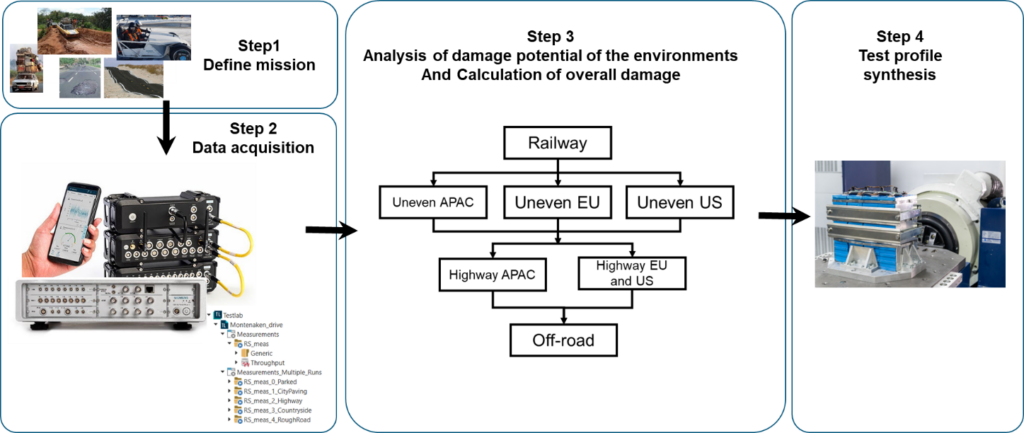
Mission Synthesis is a 4-step process to derive representative test specifications.
These four steps are represented in the picture below, illustrating an example of a battery cell that needs to be mounted on vehicles sold in different countries and undergoing different vibration events.
Step 1: Definition of the mission
The first step is to understand what the ultimate use of a device is, what are the events that are going to happen during the DUT lifetime, for how long and in which order (are these events mutually exclusive or not?). In a nutshell, its Mission. Every event needs to be represented by a dataset (typically time data, but also PSD and Sine spectra can be used, if available).
Step 2: Data acquisition
It may not have been the case for the posse of pioneers crossing the country on one of the first model T’s in 1915, but we came a long way since then and companies manufacturing vehicles are not short of data. For a specific DUT it is necessary to have acceleration measurements that are representative for the event characterizing the mission. This are typically accelerations measured at the connection between the DUT and the next level of assembly in the three orthogonal direction. For a EV car battery cell, this will be for example the connection between the battery cell and the car frame, as shown below.

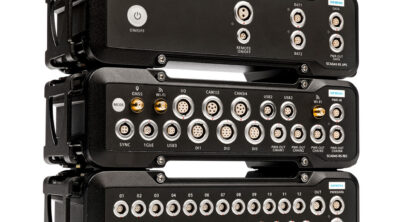
The data are generally field measurements acquired with Siemens Simcenter SCADAS Lab and Mobile and Simcenter SCADAS RS, PSDs or Sine Sweep Spectra.

Step 3: Analysis and calculation of damage
Since we want to shake the battery to check its structural and functional survivability, a very important step is then to analyze how much damage is associated with the DUT mission. This is done looking at specific spectra, called Fatigue Damage Spectrum (FDS) and Maximum Response Spectrum (MRS). In Simcenter Testlab 2406 Neo Mission Synthesis, users can quickly assemble a mission in an interactive way via the UI and calculate with few clicks the related FDS and MRS.
Step 4: Synthesis of the accelerated shaker profile
Last step for the mission synthesis procedure is synthetize a shaker test profile from the calculated damage spectra (FDS and/or MRS). Of course, a shaker test cannot last as long as the actual mission. Simcenter Testlab 2406 Neo Mission Synthesis provides an intuitive and effective way to accelerate the shaker test, preserving the calculated damage.
And now…..shake it!
Connect your Simcenter SCADAS Vibco system to the shaker amp, load the derived realistic reference profile, arm the system and, START shaking!
Weather it’s 1915 or 2024, achieving the perfect balance between weight reduction and durability is absolutely crucial. With tools like Simcenter Testlab Neo Mission Synthesis, you can ensure that your designs are both lightweight and robust, by tailoring tests to real-world conditions.
This approach not only enhances the reliability of components but also leads to better performance, greater efficiency, and ultimately, more sustainable vehicles. In the industry where there is no room for extra weight or unnecessary risk, testing smarter is the key to driving innovation forward.
