Part 9: The 2018 Wilson Research Group Functional Verification Study
IC/ASIC Verification Technology Adoption Trends
This blog is a continuation of a series of blogs related to the 2018 Wilson Research Group Functional Verification Study (click here). In my previous blog (click here), I focused on IC/ASIC design project resource trends. In this blog I examine IC/ASIC project verification technology adoption trends.
Dynamic Verification Techniques
The IC/ASIC market in the mid-2000 timeframe underwent growing pains to address increased verification complexity, predominately brought on with the adoption of SoC-class designs. This maturing of IC/ASIC projects’ processes is clearly visible when comparing various simulation-based verification technology adoption trends from 2007, 2012, and 2018, as shown in Figure 9-1.
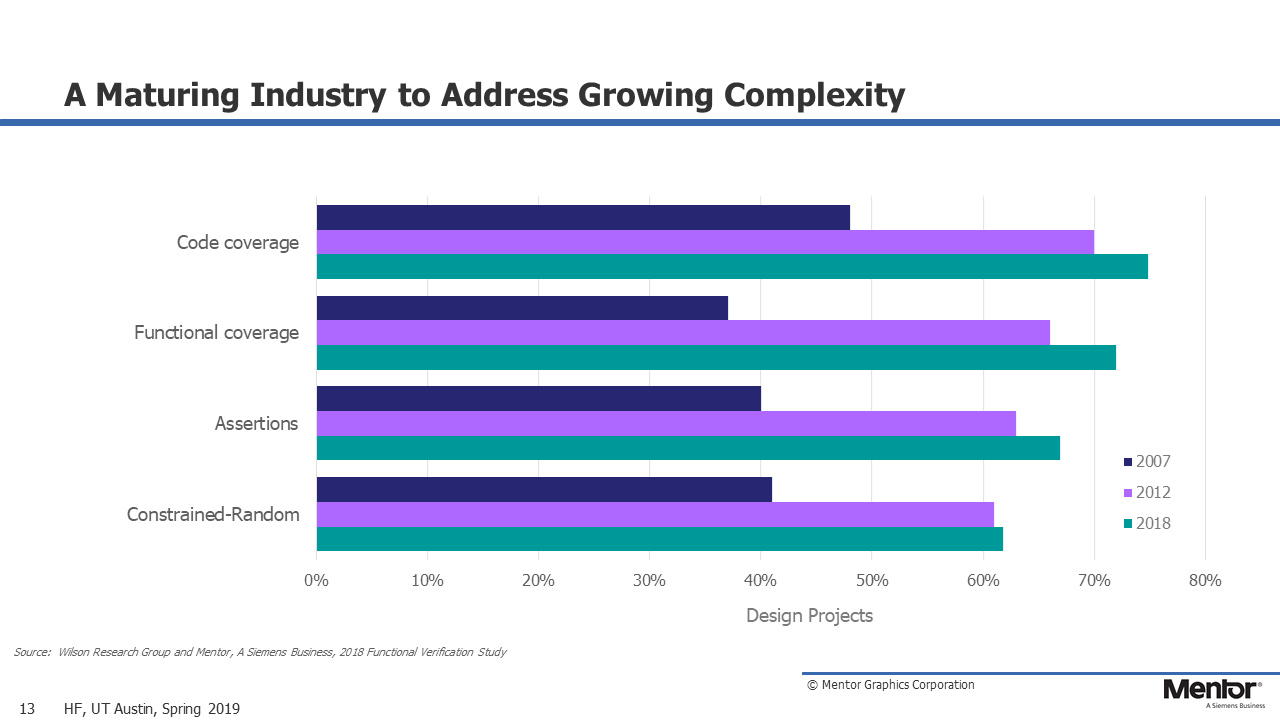
Figure 9-1. IC/ASIC Verification Technology Adoption Trends (2007-2018)
Today we find that, in general, most IC/ASIC projects have matured and adopted a common set of simulation-based verification techniques as part of their IP and subsystem verification process. As the IC/ASIC industry matures, as expected, we see a trend of verification technology adoption peaking (that is, leveling off), as shown if Figure 9-2.
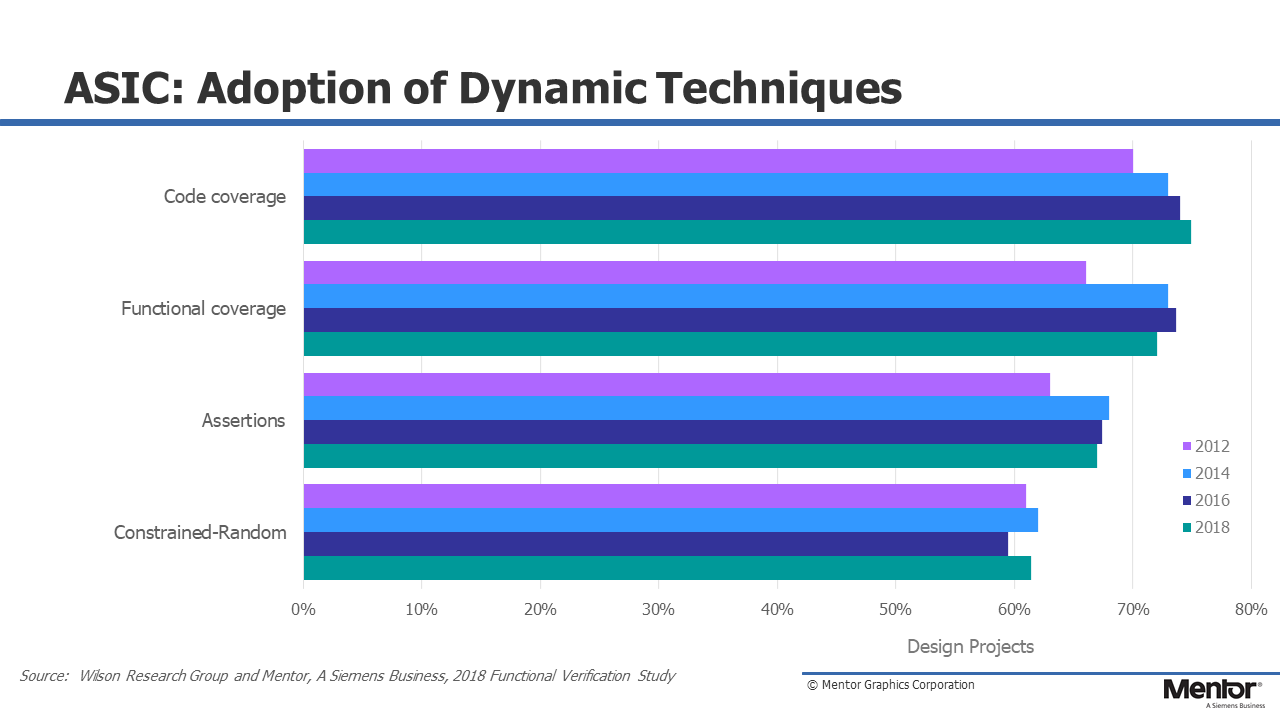
Figure 9-2. IC/ASIC Verification Technology Adoption Trends
As I mentioned in Part 7 (click here), for the past few studies we have seen a trend in terms of increased number of IC/ASIC projects working on designs less than 500K gates. It is important to keep in mind that these small projects often do not adopt advanced verification techniques, which can bias the overall industry verification technique adoption trends and appear as slight decline in adoption in some cases. The reality is that there has been little change in terms of adoption as the market matures.
IC/ASIC Static Verification Techniques
Figure 9-3 shows the IC/ASIC adoption trends for formal property checking (e.g., model checking), as well as automatic formal applications. Examples of automatic formal application tools include: SoC integration connectivity checking, deadlock detection, X semantic safety checks, coverage reachability analysis, and many other properties that can be automatically extracted and then formally proven. Note, not included in the automatic formal application trend data are clock-domain crossing CDC tools.
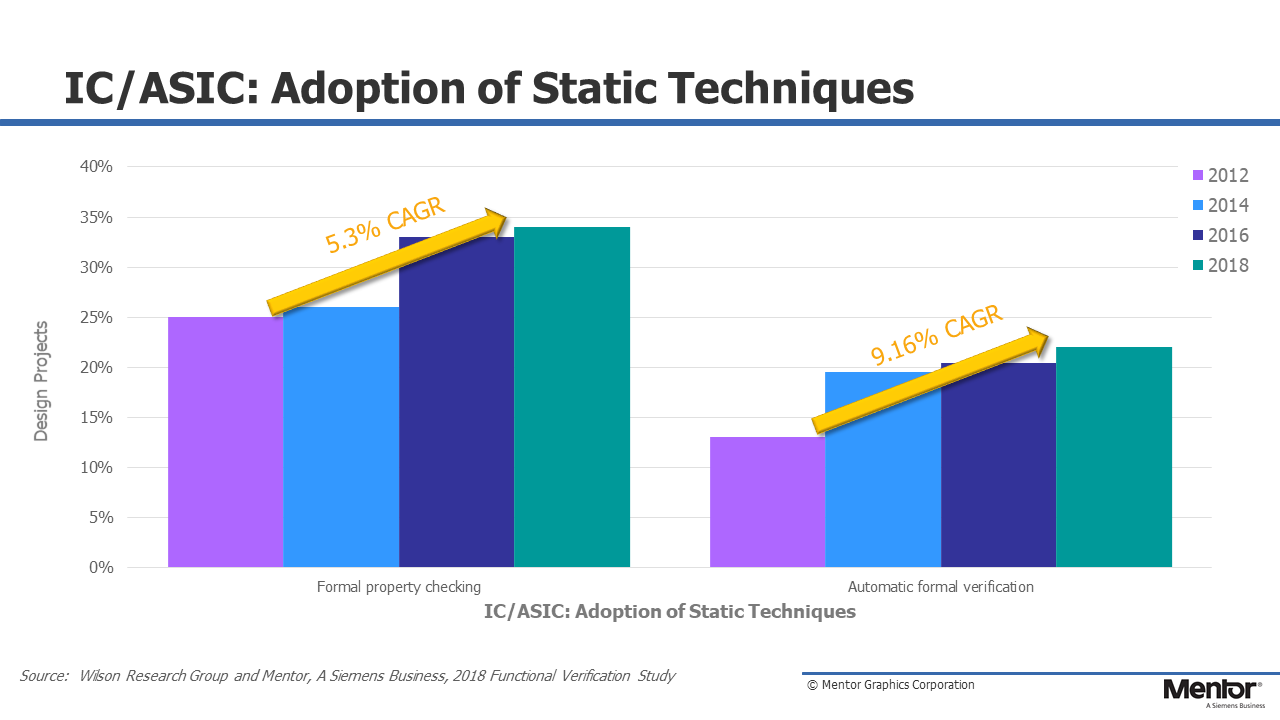
Figure 9-3. IC/ASIC Formal Technology Adoption
We see in Figure 9-3 that formal property checking has grown at a 5.4 percent CAGR since 2012, while automatic formal applications has grown at a 9.2% CAGR. Again, keep in mind the previous discussion on increasing number of small projects, which are often less mature in their verification processes. As a result this can bias the adoption trends.
Emulation and FPGA Prototyping
According to Pedestal Research the Emulation market value was forecasted to be $376M in 2018, and expected to grow at a 7.6 percent CAGR over the next few years. Pedestal Research also claims that the FPGA Prototyping market value was forecasted to be $66M in 2018 (not including home grown solutions), and expected to grow at a 9.9 percent CAGR.
Historically, the simulation market has depended on processor frequency scaling as one means of continual improvement in simulation performance. However, as processor frequency scaling levels off, simulation-based techniques are unable to keep up with today’s growing complexity. This is particularly true when simulating large designs that include both software and embedded processor core models. Hence, acceleration techniques are now required to extend SoC verification performance for very large designs. In fact, emulation and FPGA prototyping have become key platforms for SoC integration verification where both hardware and software are integrated into a system for the first time. In addition to SoC verification, emulation and FPGA prototyping are also used today as a platform for software development.
Figure 9-4 describes various reasons why projects are using emulation, while Figure 9-5 describes why FPGA Prototyping was performed. You might note that the results do not sum to 100 percent since multiple answers were accepted from each study participant.
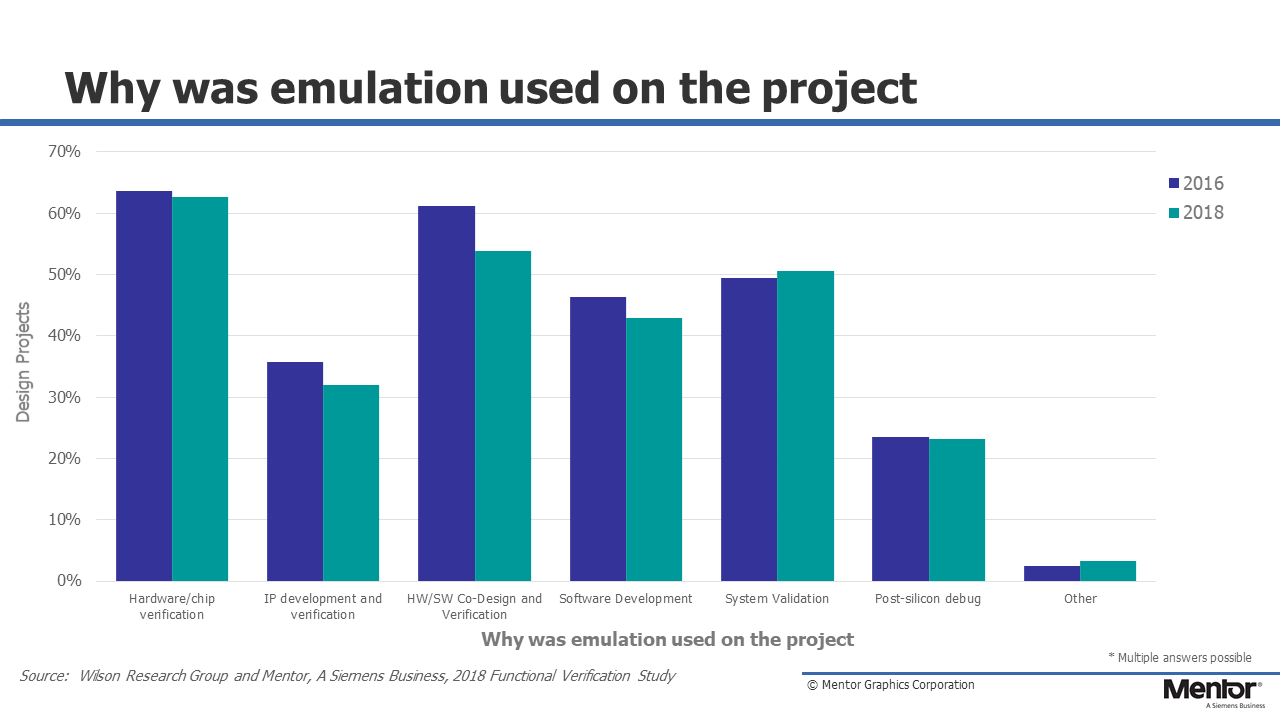
Figure 9-4. Why Was Emulation Performed?
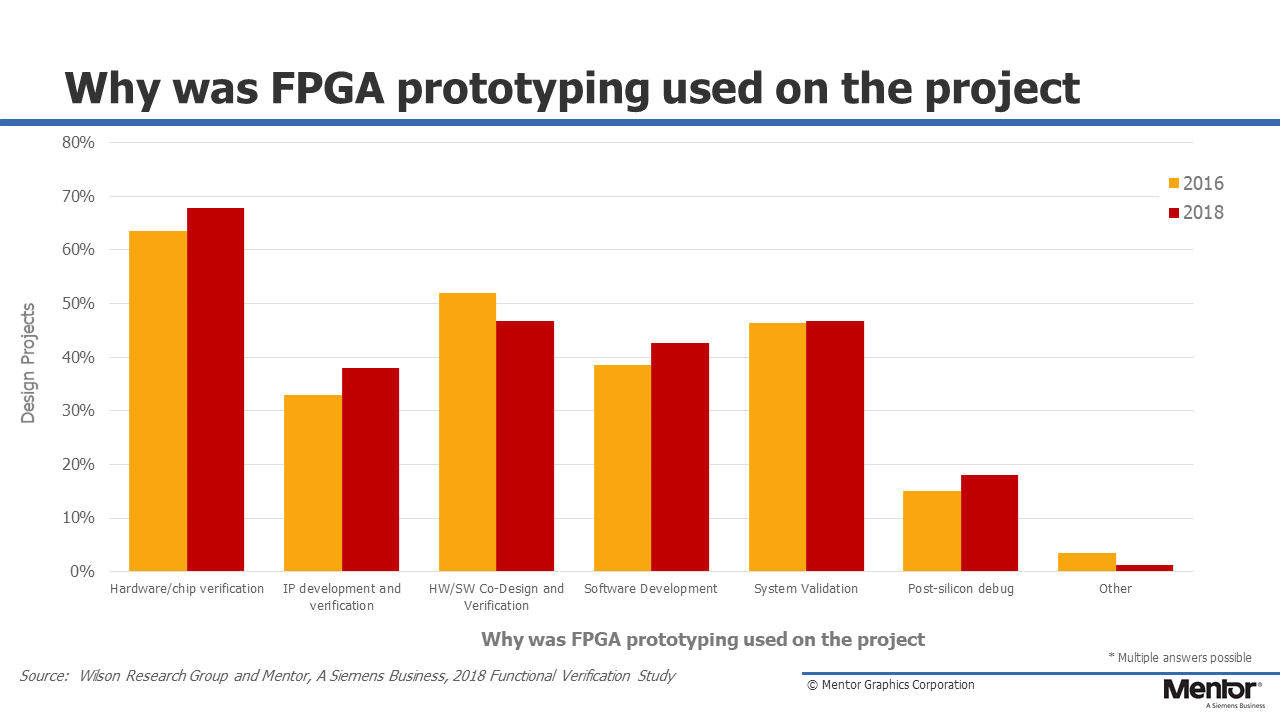
Figure 9-5. Why Was FPGA Prototyping Performed?
In my next blog (click here) I plan to discuss various IC/ASIC language and library adoption trends.
Quick links to the 2018 Wilson Research Group Study results
- Prologue: The 2018 Wilson Research Group Functional Verification Study
- Understanding and Minimizing Study Bias (2018 Study)
- Part 1 – FPGA Design Trends
- Part 2 – FPGA Verification Effectiveness Trends
- Part 3 – FPGA Verification Effort Trends
- Part 4 – FPGA Verification Effort Trends (Continued)
- Part 5 – FPGA Verification Technology Adoption Trends
- Part 6 – FPGA Verification Language and Library Adoption Trends
- Part 7 – IC/ASIC Design Trends
- Part 8 – IC/ASIC Resource Trends
- Part 9 – IC/ASIC Verification Technology Adoption Trends
- Part 10 – IC/ASIC Language and Library Adoption Trends
- Part 11 – IC/ASIC Power Management Trends
- Part 12 – IC/ASIC Verification Results Trends
- Conclusion: The 2018 Wilson Research Group Functional


Comments