Part 9: The 2016 Wilson Research Group Functional Verification Study
ASIC/IC Verification Technology Adoption Trends
This blog is a continuation of a series of blogs related to the 2016 Wilson Research Group Functional Verification Study. In my previous blog, I focused on the growing ASIC/IC design project resource trends due to rising design complexity. In this blog I examine various verification technology adoption trends.
Dynamic Verification Techniques
Figure 1 shows the ASIC/IC adoption trends for various simulation-based techniques from 2007 through 2016, which include code coverage, assertions, functional coverage, and constrained-random simulation.
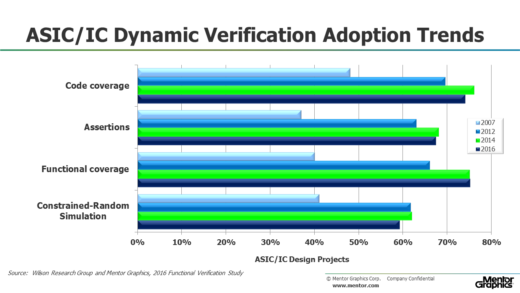
Figure 1. ASIC/IC Dynamic Verification Technology Adoption Trends
One observation from these adoption trends is that the ASIC/IC electronic design industry has matured its verification processes. This maturity is likely due to the growing complexity of designs as discussed in the previous section. Another observation is that constrained-random simulation and code coverage adoption appears to have declined. However, as I mentioned in Part 7, one interesting observation for this year’s study is that there was a large increase in design projects working on designs less than 100K gates, perhaps is due to an increased number of projects working on smaller sensor chips for IoT devices. Nonetheless, it is important to keep in mind that very small projects do not apply advanced verification techniques, which can bias the overall industry verification technique adoption trends in some cases. Hence, in reality the adoption of constrained-random simulation and code coverage has actually leveled off (versus declined) if you ignore these very small devices.
Another reason constrained-random simulation has leveled off is due to its scaling limitations. Constrained-random simulation generally works well at the IP block or subsystem level, but does not scale to the entire SoC integration level.
ASIC/IC Static Verification Techniques
Figure 2 shows the ASIC/IC adoption trends for formal property checking (e.g., model checking), as well as automatic formal applications (e.g., SoC integration connectivity checking, deadlock detection, X semantic safety checks, coverage reachability analysis, and many other properties that can be automatically extracted and then formally proven). Formal property checking traditionally has been a high-effort process requiring specialized skills and expertise. However, the recent emergence of automatic formal applications provides narrowly focused solutions and does not require specialized skills to adopt. While formal property checking adoption is experiencing incremental growth between 2012 and 2014, the adoption of automatic formal applications increased by 62 percent during this period. What was interesting in 2016 was that formal property checking experience a 31 percent increase since the 2014 study, while automatic formal applications was essentially flat, which I suspect is a temporary phenomenon. Regardless, if you calculate the compounded annual growth rate between 2012 and 2016, you see healthy adoption growth for both, as shown in Figure 2.
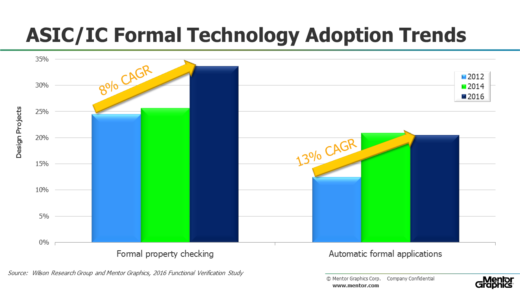
Figure 2. ASIC/IC Formal Technology Adoption
Emulation and FPGA Prototyping
Historically, the simulation market has depended on processor frequency scaling as one means of continual improvement in simulation performance. However, as processor frequency scaling levels off, simulation-based techniques are unable to keep up with today’s growing complexity. This is particularly true when simulating large designs that include both software and embedded processor core models. Hence, acceleration techniques are now required to extend SoC verification performance for very large designs. In fact, emulation and FPGA prototyping have become key platforms for SoC integration verification where both hardware and software are integrated into a system for the first time. In addition to SoC verification, emulation and FPGA prototyping are also used today as a platform for software development.
Figure 3 describes various reasons why projects are using emulation, while Figure 4 describes why FPGA Prototyping was performed. You might note that the results do not sum to 100 percent since multiple answers were accepted from each study participant.
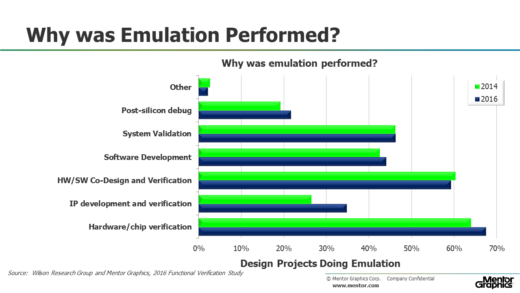
Figure 3. Why Was Emulation Performed?
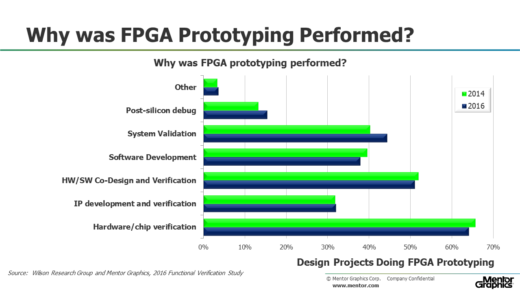
Figure 4. Why Was FPGA Prototyping Performed?
Figure 5 partitions the data for emulation and FPGA prototyping adoption by the design size as follows: less than 5M gates, 5M to 80M gates, and greater than 80M gates. Notice that the adoption of emulation continues to increase as design sizes increase. However, the adoption of FPGA prototyping levels off as design sizes increase beyond 80M gates. Actually, the level-off point is more likely around 40M gates or so since this is the average capacity limit of many of today’s FPGAs. This graph illustrates one of the problems with adopting FPGA prototyping of very large designs. That is, there can be an increased engineering effort required to partition designs across multiple FPGAs. However, better FPGA partitioning solutions are now emerging from EDA to address these challenges. In addition, better FPGA debugging solutions are also emerging from EDA to address today’s lab visibility challenges. Hence, I anticipate seeing an increase in adoption of FPGA prototyping for larger gate counts as time goes forward.
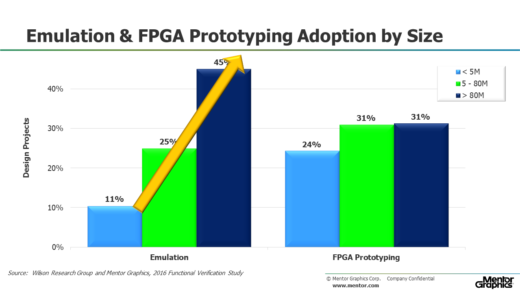
Figure 5. Emulation and FPGA Prototyping Adoption by Design Size
In my next blog I plan to discuss various ASIC/IC language and library adoption trends.
Quick links to the 2016 Wilson Research Group Study results
- Prologue: The 2016 Wilson Research Group Functional Verification Study
- Understanding and Minimizing Study Bias (2016 Study)
- Part 1 – FPGA Design Trends
- Part 2 – FPGA Verification Effort Trends
- Part 3 – FPGA Verification Effort Trends (Continued)
- Part 4 – FPGA Verification Effectiveness Trends
- Part 5 – FPGA Verification Technology Adoption Trends
- Part 6 – FPGA Verification Language and Library Adoption Trends
- Part 7 – ASIC/IC Design Trends
- Part 8 – ASIC/IC Resource Trends
- Part 9 – ASIC/IC Verification Technology Adoption Trends
- Part 10 – ASIC/IC Language and Library Adoption Trends
- Part 11 – ASIC/IC Power Management Trends
- Part 12 – ASIC/IC Verification Results Trends
- Conclusion: The 2016 Wilson Research Group Functional Verification Study

Comments