Part 9: The 2010 Wilson Research Group Functional Verification Study
Verification Techniques & Technologies Adoption Trends
This blog is a continuation of a series of blogs, which present the highlights from the 2010 Wilson Research Group Functional Verification Study (for a background on the study, click here).
In my previous blog (Part 8 click here), I focused on some of the 2010 Wilson Research Group findings related to design and verification language trends. In this blog, I present verification techniques and technologies adoption trends, as identified by the 2010 Wilson Research Group study.
One of the claims I made in the prologue to this series of blogs is that we are seeing a trend in increased industry adoption of advanced functional verification techniques, which is supported by the data I present in this blog. An interesting question you might ask is “what is driving this trend?” In some of my earlier blogs (click here for Part 1 and Part 2) I showed an industry trend in that design complexity is increasing in terms design sizes and number of embedded processors. In addition, I’ve presented trend data that showed an increase in total project time and effort spent in verification (click here for Part 4). My belief is that the industry is being forced to mature its functional verification process to address increasing complexity and effort.
Simulation Techniques Adoption Trends
Let’s begin by comparing the adoption trends related to various simulation techniques as shown in Figure 1, where the data from the 2007 Far West Research study is shown in blue and the data from 2010 Wilson Research Group study is shown in green. 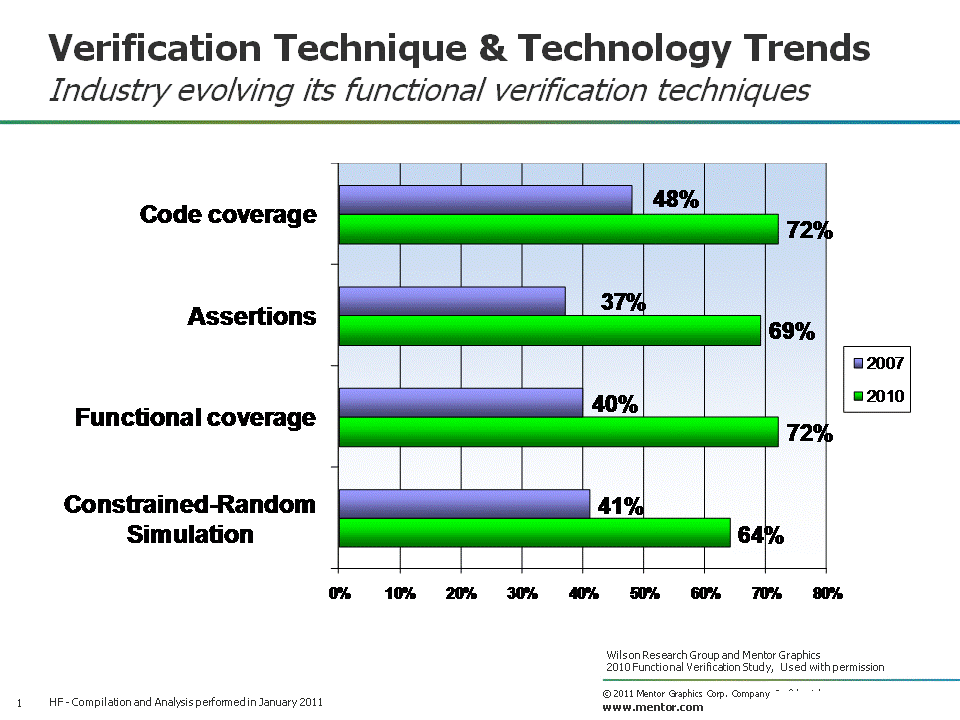
Figure 1. Simulation-based technique adoption trends
You can see that the study finds the industry increasing its adoption of various functional verification techniques.
For example, in 2007, the Far West Research Group found that only 48 percent of the industry performed code coverage. This surprised me. After all, HDL-based code coverage is a technology that has been around since the early 1990’s. However, I did informally verify the 2007 results through numerous customer visits and discussions. In 2010, we see that the industry adoption of code coverage has increased to 72 percent.
Now, a side comment: In this blog, I do not plan to discuss either the strengths or weaknesses of the various verification techniques that were studied (such as code coverage, whose strengths and weaknesses have been argued and debated for years)—perhaps in a separate series of future blogs. In this series of blogs, I plan to focus only on the findings from the 2010 Wilson Research Group study.
In 2007, the Far West Research Group study found that 37 percent of the industry had adopted assertions for use in simulation. In 2010, we find that industry adoption of assertions had increased to 72 percent. I believe that the maturing of the various assertion language standards has contributed to this increased adoption.
In 2007, the Far West Research Group study found that 40 percent of the industry had adopted functional coverage for use in simulation. In 2010, the industry adoption of functional coverage had increased to 69 percent. Part of this increase in functional coverage adoption has been driven by the increased adoption of constrained-random simulation, since you really can’t effectively do constrained-random simulation without doing functional coverage.
In fact, we see from the Far West Research Group 2007 study that 41 percent of the industry had adopted constrained-random simulation techniques. In 2010, the industry adoption had increased to 69 percent. I believe that this increase in constrained-random adoption has been driven by the increased adoption of the various base-class library methodologies, as I presented in a previous blog (click here for Part 8).
Formal Property Checking Adoption Trends
Figure 2 shows the trends in terms of formal property checking adoption by comparing the 2007 Far West Research study (in blue) with the 2010 Wilson Research Group study (in green). The industry adoption of formal property checking has increased by an amazing 53 percent in the past three years. Again, this is another data point that supports my claim that the industry is starting to mature its adoption of advanced functional verification techniques.
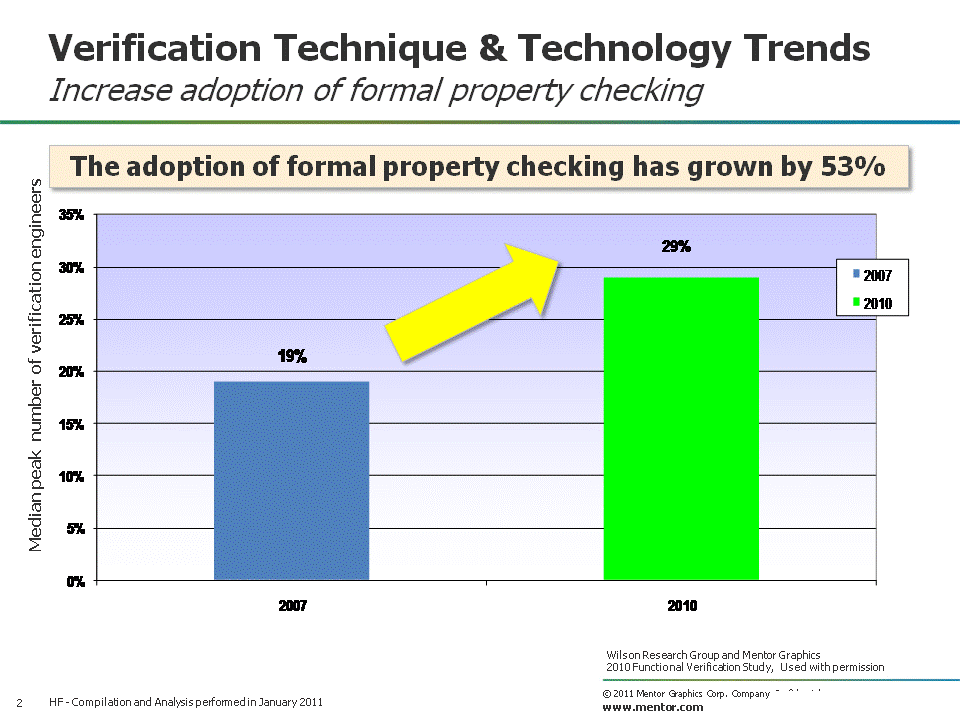
Figure 2. Trends in formal property checking adoption
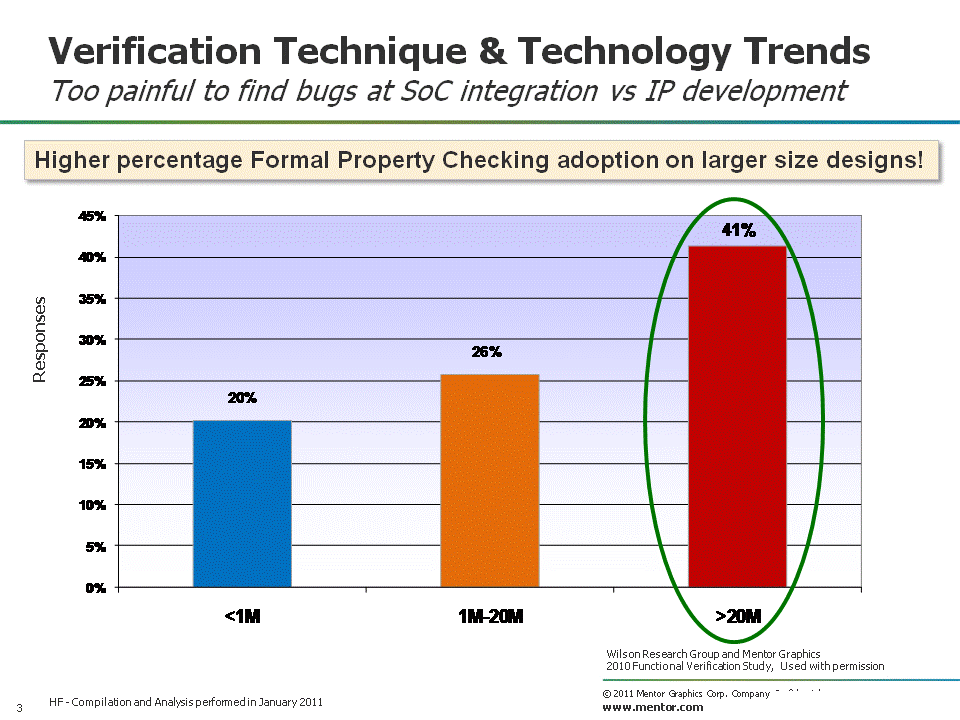
Another way to analyze the results is to partition a project’s adoption of formal property checking by design size, as shown in Figure 3, where less than 1M gates is shown in blue, 1M to 20M gates is shown in orange, and greater than 20M gates is shown in red. Obviously, the larger the design, the more effort is generally spent in verification. Hence, it’s not too surprising to see the increased adoption of formal property checking for larger designs.
Figure 3. Trends in formal property checking adoption by design size
Acceleration/Emulation & FPGA Prototyping Adoption Trends
The amount of time spent in a simulation regression is an increasing concern for many projects. Intuitively, we tend to think that the design size influences simulation performance. However, there are two equally important factors that must be considered: number of test in the simulation regression suite, and the length of each test in terms of clock cycles.
For example, a project might have a small or moderate-sized design, yet verification of this designs requires a long running test (e.g., a video input stream). Hence, in this example, the simulation regression time is influenced by the number of clock cycles required for the test, and not necessarily the design size itself.
In blog 6 of this series, I presented industry data on the number of tests created to verify a design in simulation (i.e., the regression suite). The findings obviously varied dramatically from a handful of test to thousands of test in a regression suite, depending on the design. In Figure 4 below, I show the findings for a projects regression time, which also varies dramatically from short regression times for some projects, to multiple days for other projects. The median simulation regression time is about 16 hours in 2010. 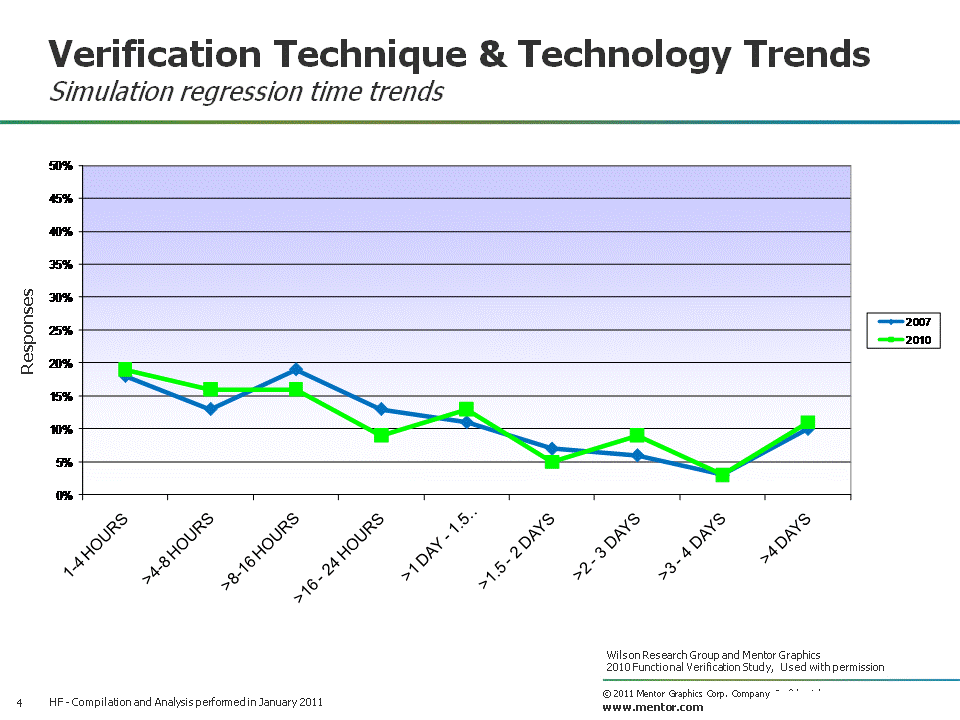
Figure 4. Simulation regression time trends
One technique that is often used to speed up simulation regression (either due to very long test and lots of test) is either hardware assisted acceleration or emulation. In addition, FPGA prototyping, while historically used as a platform for software development, has recently served a role in SoC integration validation.
Figure 5 shows the adoption trend for both HW assisted acceleration/emulation and FPGA prototyping by comparing the 2007 Far West Research study (in blue) with the 2010 Wilson Research Group study (in green). We have seen a 75 percent increase in the adoption of HW assisted acceleration/emulation over the past three years. 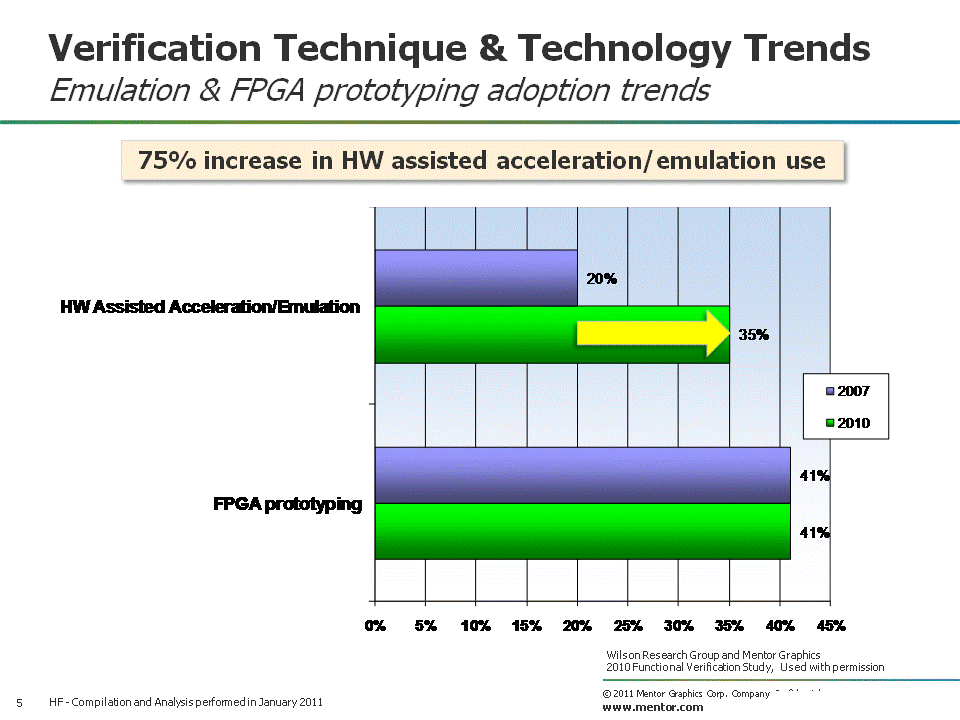
Figure 5. HW assisted acceleration/emulation and FPGA Prototyping trends
I was surprised to see that the adoption of FPGA prototyping did not increase over the past three years, considering that we found in increase in SoC development over the same period. So, I decided to dig deeper into this anomaly.
In Figure 6, you’ll see that I partitioned the HW assisted acceleration/emulation and FPGA prototyping adoption data by design size: less than 1M gates (in blue), 1M to 20M gates (in yellow), and greater than 20M gates (in red). This revealed that the adoption of HW assisted acceleration/emulation continued to increase as design sizes increased. However, the adoption of FPGA prototyping rapidly dropped off as design sizes increased beyond 20M gates. 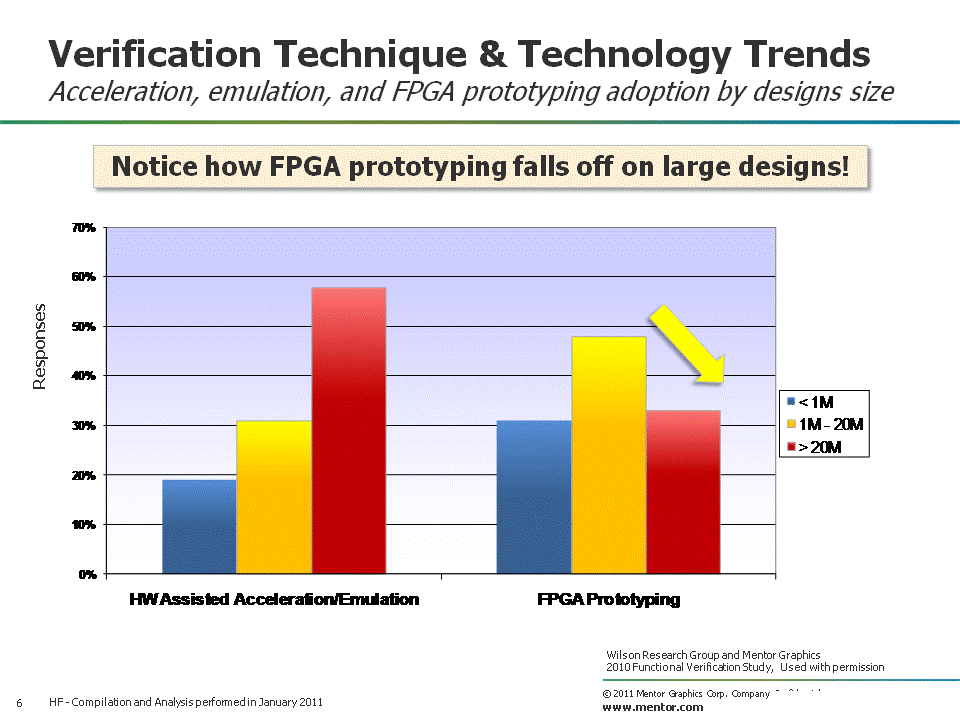
Figure 6. Acceleration/emulation & FPGA Prototyping adoption by design size
So, what’s going on? One problem with FPGA prototyping of large designs is that there is an increased engineering effort required to partition designs across multiple FPGAs. In fact, what I have found is that FPGA prototyping of very large designs is often a major engineering effort in itself, and that many projects are seeking alternative solutions to address this problem.
In my next blog, I plan to present the 2010 Wilson Research Group study findings related to various project results in terms of schedule and required spins before production.
Comments
Leave a Reply
You must be logged in to post a comment.


Hi Harry,
In terms of adoption of Assertions, do you have the trend in terms of –
1. Adoption of assertions/formal verification to completment dynamic simulations.
2. Adoption of assertions/formal verification to replace dynamic simulations?
Regards,
Gaurav Jalan
http://whatisverification.blogspot.com
Hi Gaurav,
The Wilson Research Group study separated formal property checking from simulation-based ABV. Hence, the numbers reported on assertion adoption were related to simulation
Concerning replacing simulation by formal property checking, we don’t have any credible numbers on this. Imperically, it appears to be to me that few projects actually rcompletely replace simulation with formal. Most projects augment dynamic techniques to increase confidence, and drive the bug curve down quickly.