Part 7: The 2010 Wilson Research Group Functional Verification Study
Testbench Characteristics and Simulation Strategies (Continued)
This blog is a continuation of a series of blogs, which present the highlights from the 2010 Wilson Research Group Functional Verification Study (for a background on the study, click here).
In my previous blog (Part 6 click here), I focused on some of the 2010 Wilson Research Group findings related to testbench characteristics and simulation strategies. In this blog, I continue this discussion, and present additional findings specifically related to the number of tests created by a project, as well as the length of time spent in a simulation regression run for various projects.
Percentage directed tests created by a project
Let’s begin by examining the percentage of directed tests that were created by a project, as shown in Figure 1. Here, we compare the results for FPGA designs (in grey) and non-FPGA designs (in green).
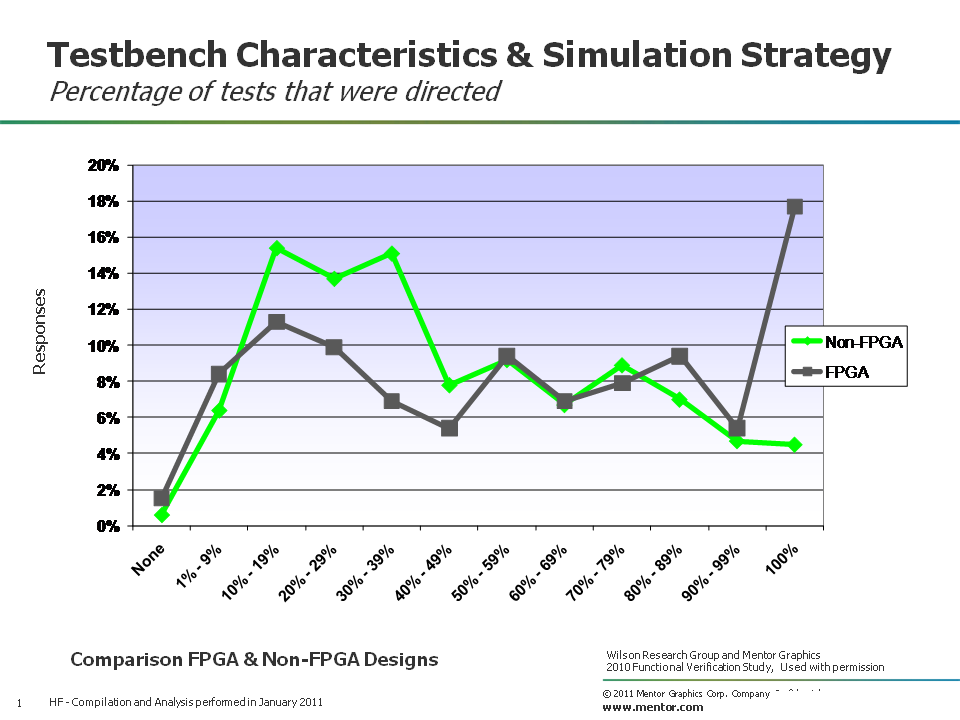
Figure 1. Percentage of directed testing by a project
Obviously, the study results are all over the spectrum, where some projects create more directed tests than others. The study data revealed that FPGA design participants tend to belong to a higher percentage of projects that only do directed tests.
Figure 2 shows the median number of directed tests created on a project by region, where North America (in blue), Europe/Israel (in green), Asia (in green), and India (in red). 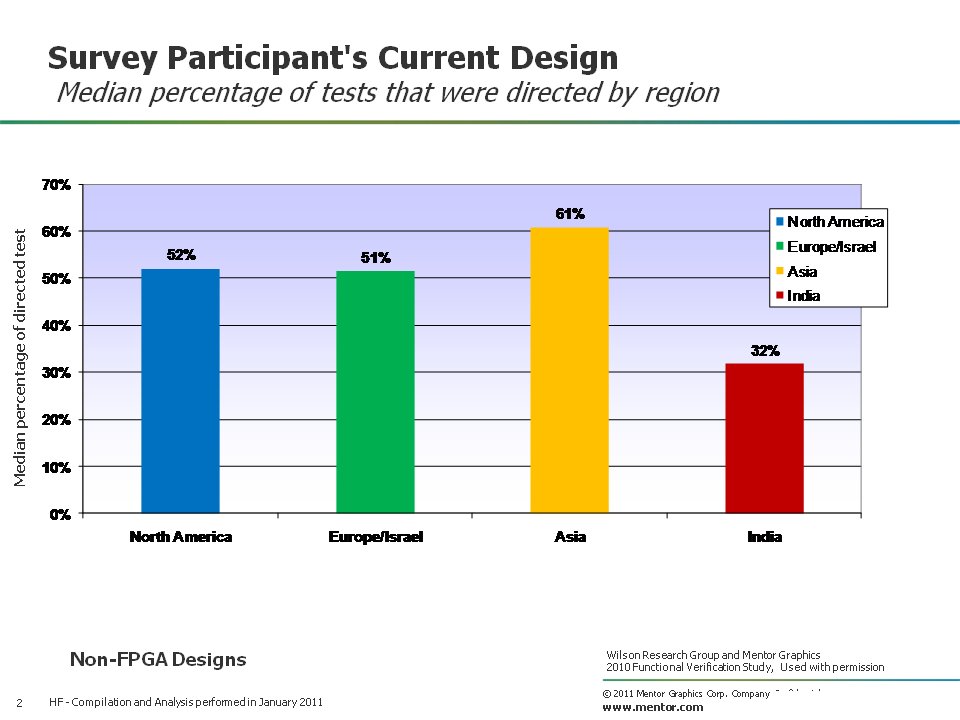
Figure 2. Median percentage of directed testing by a project by region
You can see from the results that India seems to spend less time focused on directed testing compared with other regions, which means that India spends more time with alternative stimulus generation methods (such as, constrained-random, processor-driven, or graph-based techniques).
Let’s look at the percentage of directed testing by design size, for non-FPGA projects. The median results are shown in Figure 3, where the design size partitions are represented as: less than 1M gates (in blue), 1M to 20M gates (in orange), and greater than 20M gates (in red).
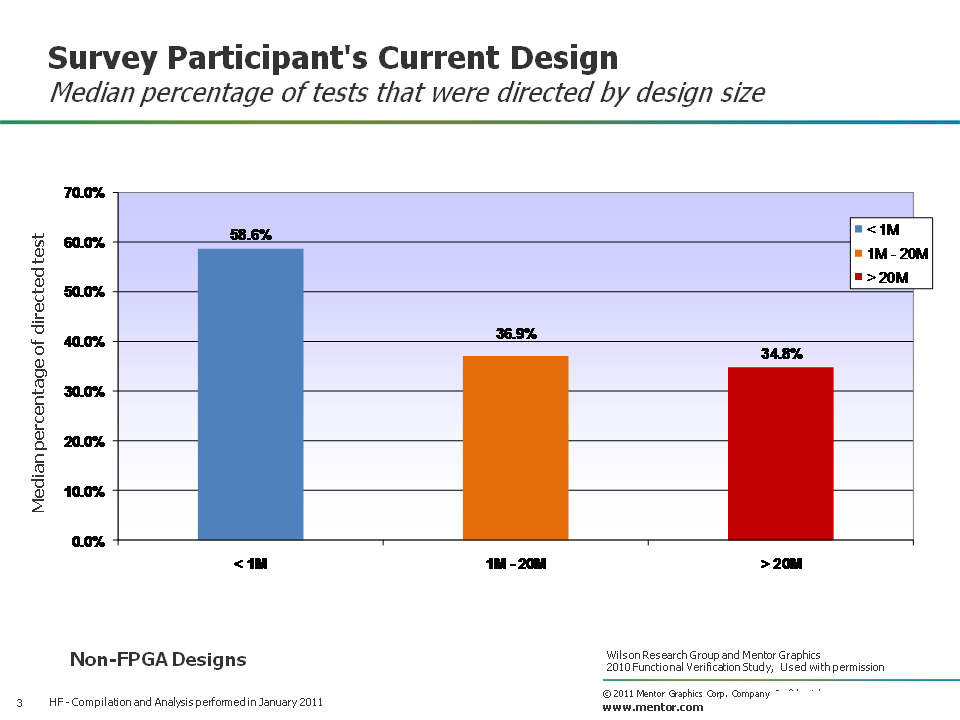
Figure 3. Median percentage of directed testing by a project by design size
As design sizes increase, there is less reliance on directed testing.
Percentage of project tests that were random or constrained random
Next, let’s look at the percentage of tests that were random or constrained random across multiple projects. Figure 4 compares the results between FPGA designs (in grey) and non-FPGA designs (in green).
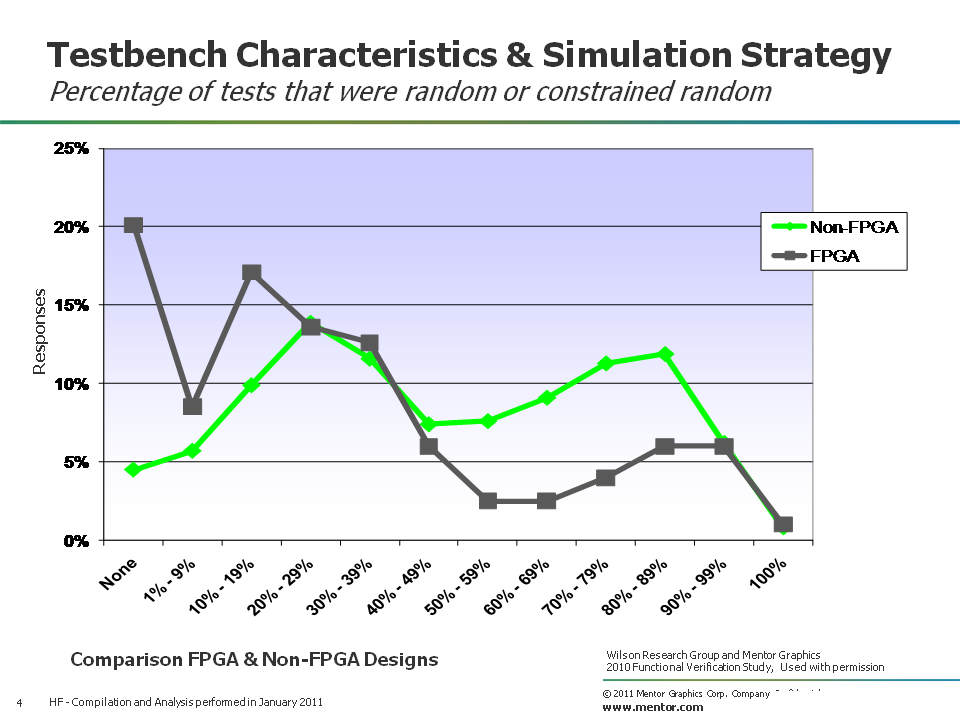
Figure 4. Percentage of random or constrained-random testing by a project
And again, the study results indicate that projects are all over the spectrum in their usage of random or constrained-random stimulation generation. Some projects do more, while other projects do less.
Figure 5 shows the median percentage of random or constrained-random testing by region, where North America (in blue), Europe/Israel (in green), Asia (in green), and India (in red).
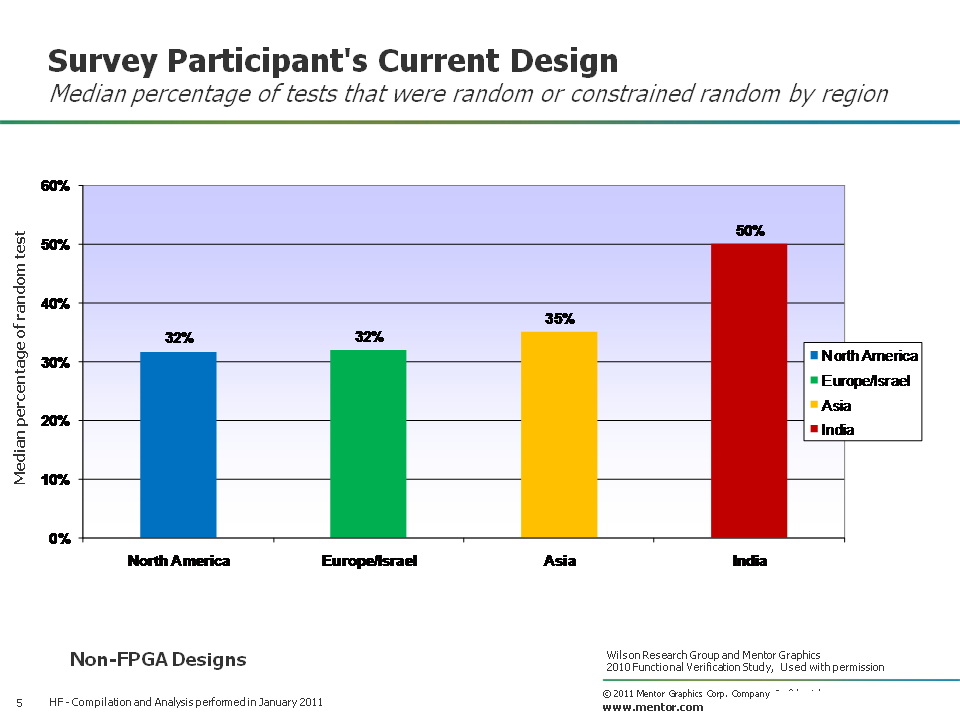
Figure 5. Median percentage of random or constrained-random testing by region
You can see that the median percentage of random or constrained-random testing by a project is higher in Indian than other regions of the world.
Let’s look at the percentage of random or constrained-random testing by design size, for non-FPGA projects. The median results are shown in Figure 6, where the design size partitions are represented as: less than 1M gates (in blue), 1M to 20M gates (in orange), and greater than 20M gates (in red).
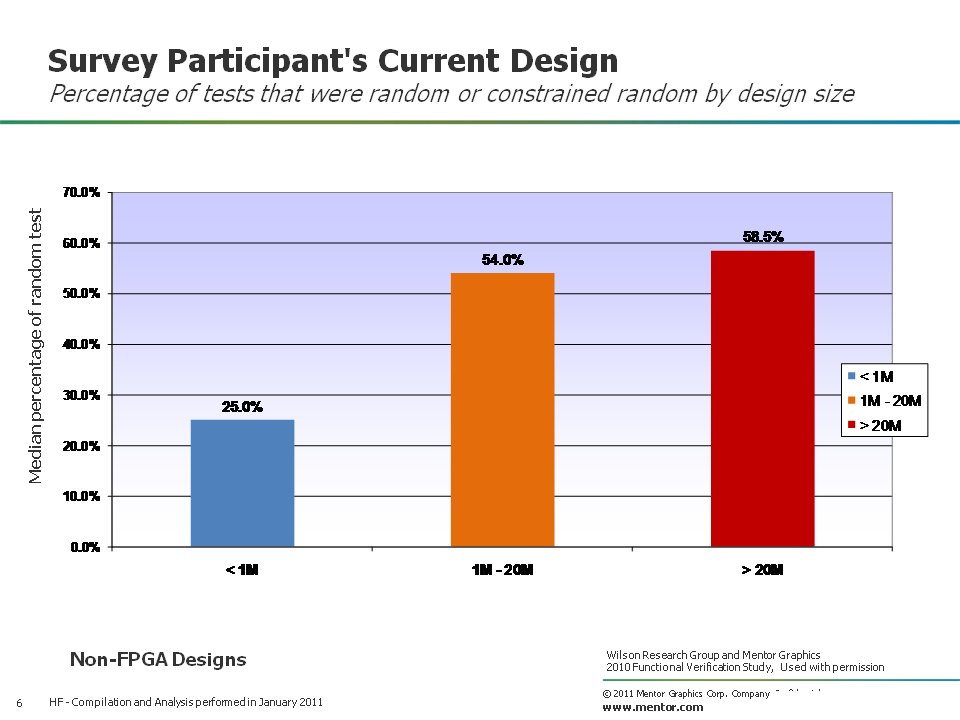
Figure 6. Median percentage of random or constrained-random testing by design size
Smaller designs tend to do less random or constrained-random testing.
Simulation regression time
Now, let’s look at the time that various projects spend in a simulation regression. Figure 7 compares the simulation regression time between FPGA designs (in grey) and non-FPGA designs (in green) from our recent study.
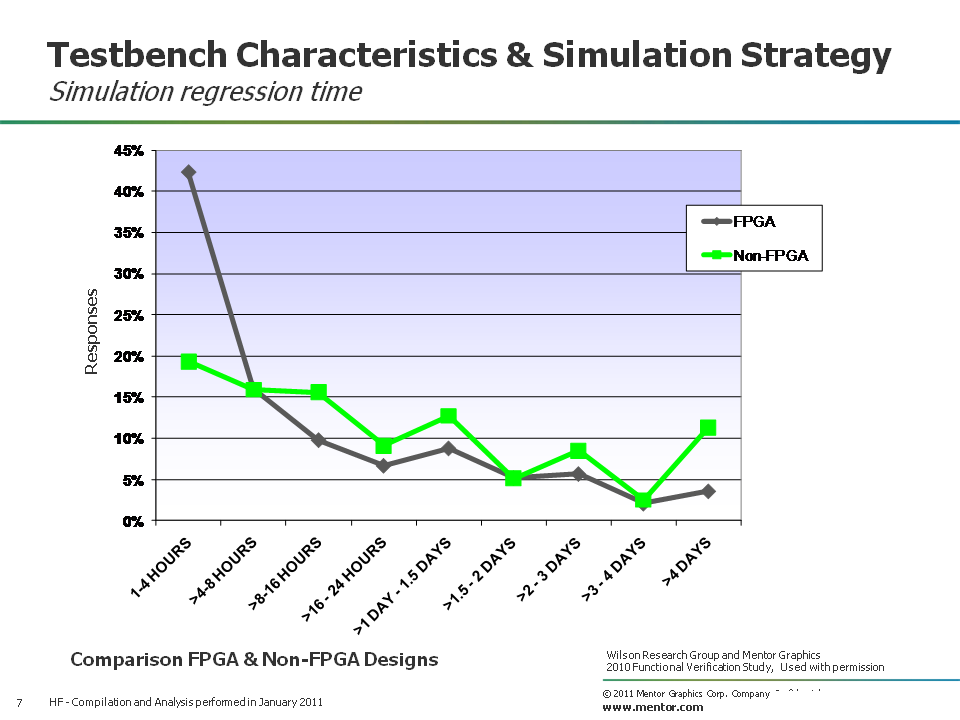
Figure 7. Time spent in a simulation regression by project
And again, we see that FPGA projects tend to spend less time in a simulation regression run compared to non-FPGA projects.
Figure 8 shows the trends in terms of simulation regression time by comparing the 2007 Far West Research study (in blue) with the 2010 Wilson Research Group study (in green). There really hasn’t been a significant change in the time spent in a simulation regression within the past three years. You will find that some teams spend days or even weeks in a regression. Yet, the industry median is about 16 hours for both the 2007 and 2010 studies.
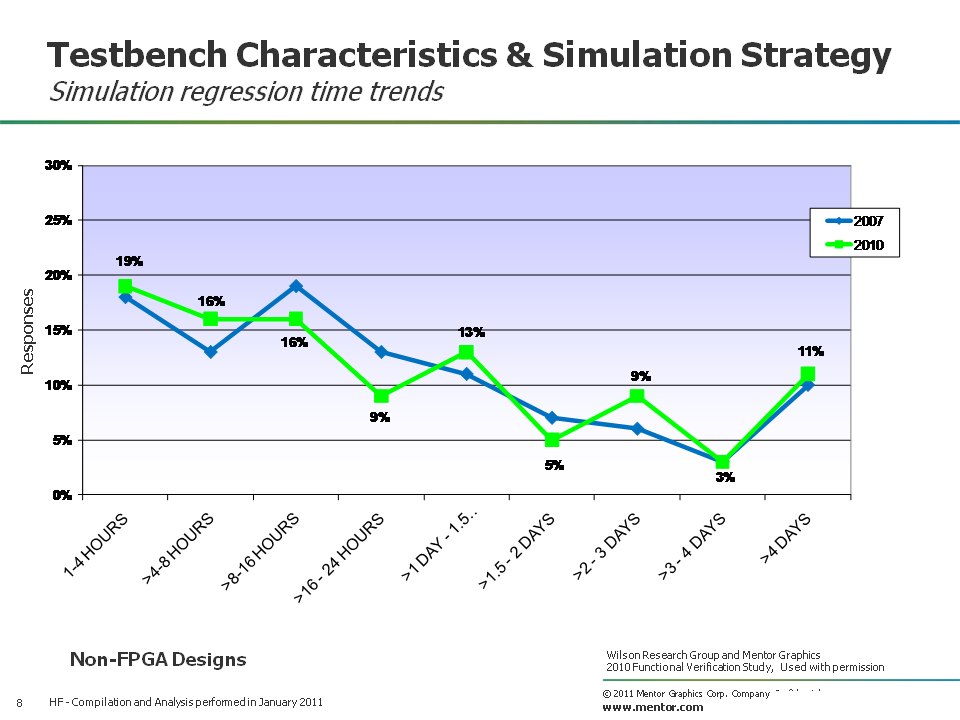
Figure 8. Simulation regression time trends
Figure 9 shows the median simulation regression time by region, where North America (in blue), Europe/Israel (in green), Asia (in green), and India (in red).
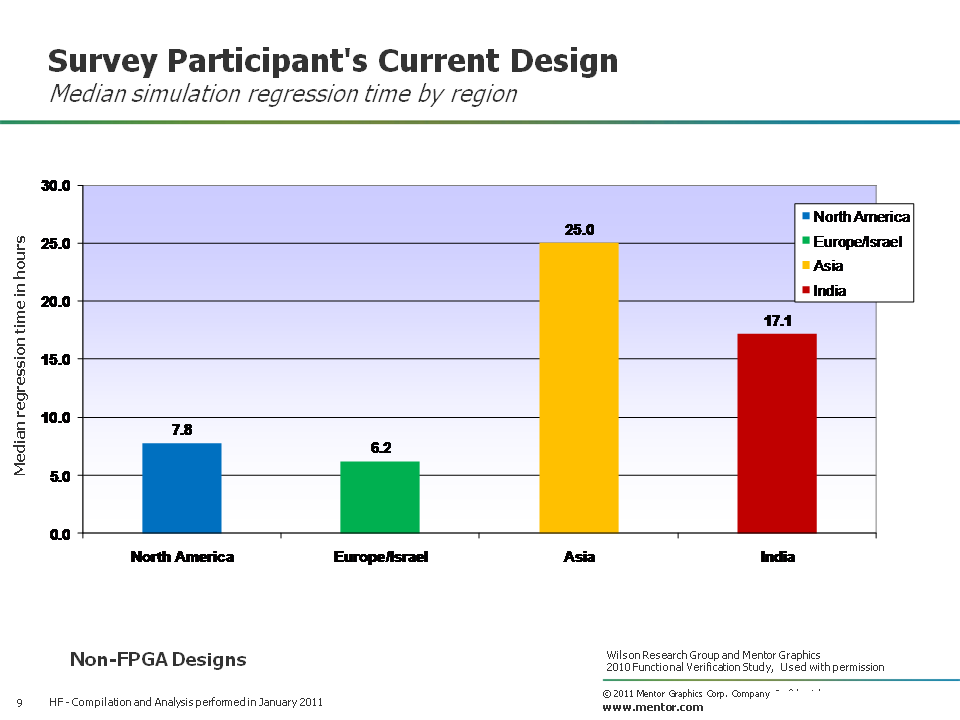
Figure 9. Median simulation regression time by regions
Finally, Figure 10, shows the median simulation regression time by design size, where the design size partitions are represented as: less than 1M gates (in blue), 1M to 20M gates (in orange), and greater than 20M gates (in red).
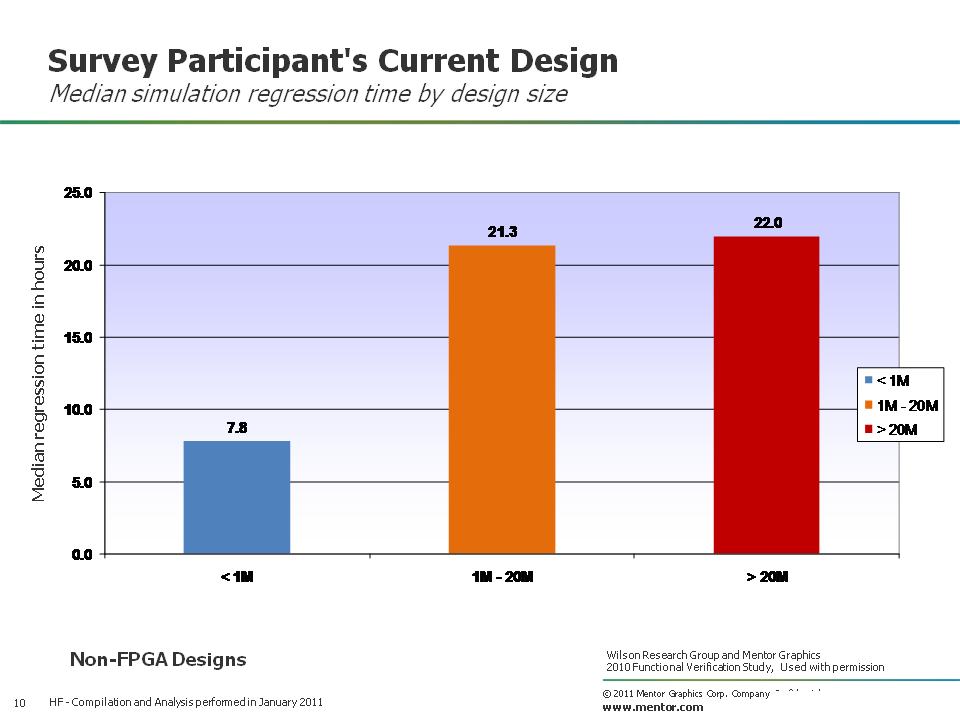
Figure 10. Median simulation regression time by design size
Obviously, project teams working on smaller designs spend less time in a simulation regression run compared to project teams working on larger designs.
In my next blog (click here), I’ll focus on design and verification language trends, as identified by the 2010 Wilson Research Group study.