Debugging a RISC-V processor requires integrated hardware and software tools
To debug a RISC-V processor that comprises tens or hundreds of cores and processes billions of instructions each second can be challenging. Is the software running as expected? Is memory being used efficiently? What’s causing hardware and software deadlocks in a system? Are there instructions that could be optimised? How can a random longtail problem that occurs intermittently be tracked down? Does the verification team see the same behaviour as the firmware engineers or application developers?
Software tools can provide some answers, but they often use system resources that affect how an application runs which could cause irregular software behaviour, or require extensive instrumentation to capture the information needed to identify the root cause of a problem.
SoC development teams are increasingly demanding that any RISC-V core includes a processor hardware trace solution that they can use to reconstruct instruction execution sequences, but the volume of trace data generated can quickly overwhelm the system leading to lost trace information or additional on-chip storage and system resources.
Hardware and software
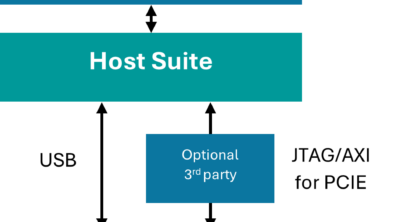
Standard software tools and processes remain the debugging backbone, but they need to be closely integrated with the hardware when debugging complex processors. Collectively the hardware and software tools can provide a deterministic solution that captures accurate and robust data, sometimes over weeks or months, while avoiding the introduction of additional errors during verification, application development and testing. The captured data can be output to the host across high-bandwidth output interfaces (e.g. PCIe, USB3 and SerDes) to build a model of the device when an event of interest happened.
Embedded and host software can use low-bandwidth input interfaces (e.g. USB2 and JTAG) to input system data including executable file and code uploads, or hardware configuration information. The combination of hardware and software tools allows critical issues to be investigated in real-time on or off chip using the data captured by the hardware. In addition, the data can be stored off-chip for further analysis, performance optimisation and code coverage review.
Efficient hardware trace
Regardless of which output interfaces are used, the ability to manage the volume of data that trace can generate is crucial. Instead of trying to offload every byte of data to a host system, the hardware trace tools should be able to filter captured trace for transactions of interest so that only relevant data is output and then apply highly optimised compression to reduce the volume of data transferred – every byte counts.
As data is often captured in bursts, the hardware needs options to minimise the risk of bottlenecks on the device and lost data when streaming it to the software tools. The hardware should be able to capture trace from multiple sources at the same time, with the necessary timestamps and metadata to ensure that the software can reconstruct the device behaviour at a specific event.
Providing additional capabilities
Debugging a processor is not just about processor trace. The hardware can include additional modules that communicate in real-time with each other, so they all know when an event of interest occurs. For example, a processor module that manages the function calls from the host software (e.g. stop, start and breakpoints) can trigger the trace encoder or instruct a DMA module to read system memory values when an event occurs. The same hardware DMA module can also be used to significantly reduce the time taken to upload executable ELF files and run new software iterations or enable the reset register.
Hardware counters provide an extremely efficient way to capture useful data like the number of times an instruction is executed, or a function is called. Software functions like printf can be replaced by hardware macros embedded in the ELF file that take a few cycles to capture and output to host tools to decode and analyse. These counters and macros can be used to provide extensive profiling information and performance indicators with minimal or no effect on the application behaviour.
Summary
Adding hardware modules to a RISC-V design to support software debugging tools comes with an area cost and additional verification requirements that need to be considered in advance as embedded software engineers are the people most likely to use the data captured by the hardware later in the device lifecycle.
The benefits, however, are significant as the data captured by the hardware can provide software engineers with the information they need to understand how their applications run on the device under the most stringent real operating conditions.
The combination of hardware and software tools can reduce development time, improve processor and application performance, deliver 100% code coverage and reduce the critical time to market.
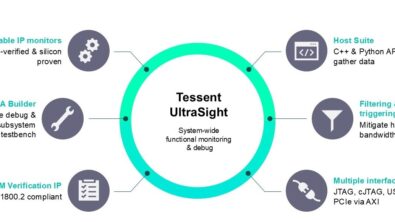
Tessent Embedded Analytics from Siemens EDA offers an integrated range of hardware and software tools that accelerate debug of RISC-V based SoCs.