Debugging RISC-V processors using E-Trace
Debugging RISC-V-based SoCs can be challenging even for devices with only a few cores. The modular nature of the RISC-V ISA allows chip designers to customise their devices using ISA extensions including custom instructions to speed up critical operations and accelerate their application. This flexibility can introduce further verification and validation requirements to ensure that the combination of extensions and customization not just works but does not break anything else while delivering expected performance.
Processor trace is a common non-intrusive debugging technique which many development teams and customers expect as a minimum feature of any SoC deliverable. Trace captures, encodes and transmits off-chip a record of executed processor instructions, which software tools can use to reconstruct the exact execution sequence of a program. Embedded developers can then inspect the execution sequence to verify the RISC-V ISA, debug application code, profile the processor and explore code coverage.
How does RISC-V trace work?
Instead of trying to capture every instruction possible, which would lead to unmanageable volumes of data, the Efficient Trace for RISC-V (E-Trace) standard uses Processor Branch Trace. It reports a known start address within the program binary (ELF file) that the software can identify, and then captures branches (jumps, calls, returns, interrupts or exceptions) and whether the branch is taken or not. All instructions that exist between branch instructions are assumed to execute sequentially and there is no need to report them. Indirect jumps, interrupts and exceptions (known as uninferable program counter discontinue) occur when the program counter is changed by an amount which cannot be determined from the program binary alone and require the destination address to be reported. Interrupts (and exceptions) generally occur asynchronously and require the address where normal program flow ceased to also be reported. Branch trace is also known as Instruction Delta Tracing since deltas are typically introduced by branch instructions.
Processor branch trace achieves very high compression, as only branches (or deltas) in the program code are reported and output to the software. This means more trace data can be captured, multiple cores can be traced simultaneously, or larger trace history can be saved to a fixed size trace buffer. The most efficient trace encoders with the highest compression can also place fewer requirements on the off-chip transport mechanism, so fewer pins, lower power, or less sophisticated interface IP is required.
Benefits of trace
Once the instruction sequence has been reconstructed, engineers can use it to diagnose common problems that are nearly impossible to find using traditional debug techniques, including application crashes, or programming errors that have irregular symptoms and occur sporadically. Bugs that are rare and dependent on order-of-execution are much easier to identify and reproduce as the trace provides a trail of what the program has executed and the order in which it was executed. Without trace, the source of an application crash can be very hard to identify.
As trace is non-intrusive and software running on the processor will run smoothly while trace is captured, it can be used to profile an application. For example, trace can be used to confirm that it runs as intended, understand where most of the execution time is spent, and how fast it responds with different parameters.
Trace can also be used to implement code coverage, confirm that code has been exercised at least once, collect data about how many times an individual instruction was run and show test deficiencies. The option to identify any part of the code which is not reachable is a mandatory requirement for developers working with critical safety applications.
Efficient Trace for RISC-V
The Efficient Trace for RISC-V standard has a mandatory set of features that include the Instruction Trace, Hart-to-Encoder interface, Delta-Address trace mode and efficient trace packet format used to encode the captured trace data to the host.
Optional features include multiple instruction retirements as used by superscalar and out-of-order processor implementations, data trace, optional instruction trace encoding modes and packet compression techniques.
One significant feature which is implemented by the Tessent Enhanced Trace Encoder from Siemens EDA, is cycle-accurate trace, which enables the user to optimize software performance by identifying where a hart is stalling.
Summary
Efficient processor trace is a critical tool for engineers responsible for debugging RISC-V cores with multiple extensions and customer instructions. It enables forensic debugging, random bugs identification and avoidance of Heisenbugs (those that vanish when you study them), as well as performance profiling and code coverage.
LEARN MORE
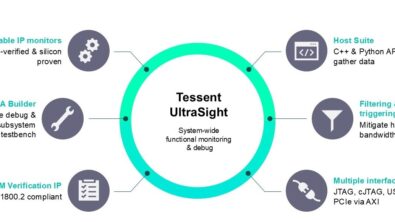
Tessent Embedded Analytics from Siemens EDA offers an integrated range of hardware and software tools that accelerate debug of RISC-V based SoCs.