Where does electricity come from to power your electric car?
While we are all on lockdown it is rather interesting to consider how our energy usage has changed from a month ago. I am sure that many of you have seen the drastic difference in nitrogen dioxide pollution over China by now and this got me wondering about how this affects us in the UK. More specifically, now that we are all working from home are we using more or less energy?

This is particularly interesting as it can shape a number of things going forward. Currently we are all stuck at home for a minimum of three weeks but some scientists have stated that these measures could last as much as 18 months (Neil M Ferguson, 2020). This poses the question, while we are using a lot less fuel in our cars are we using more or less electricity by all working at home?
While the month of March hasn’t yet concluded we can compare what we have used so far this month with what we used in 2019. As an average we have used 32.9 GW this March compared with 31.7 GW last year.
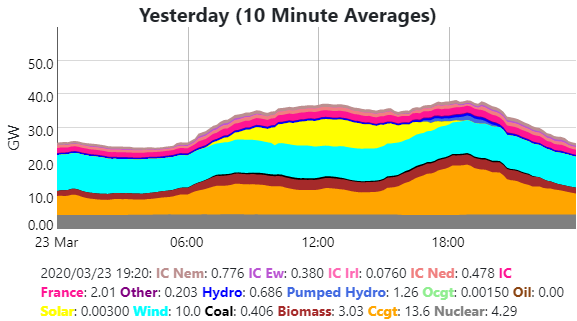
This isn’t a significant enough difference to show a correlation. You need to remember that many facilities were still open at the beginning of the month. If you compare the 23th March across both years, this shows a similar difference between 31.9GW in 2020 to 30.8GW in 2019.
When you think about this in more depth though an interesting story starts to emerge. A lot of manufacture has shut down which would use a lot of energy, this also includes shops, leisure centres and many other facilities. This has offset with all the additional heating, lighting, and electronics such as monitors, radios, TV’s, and equipment that are in addition to our laptops that we use in the office. By not working in a single building all day these demands have increased massively.
So how does this relate to nuclear power and next generation electric vehicles?
Well if we were to continue to work at home but manufacture and leisure facilities were allowed to re-open then we would have a massive energy shortage. By considering the energy consumption breakdown we can understand how much industry and services account for our total energy usage:

Transport is predominantly oil based so we won’t consider this here. Goods and services make up 25% of the UK’s energy usage and of this, 34% is in the form of electricity. Manufacturing and industry shows a similar trend which consume 16% of our total energy produced with 35% of that made up of electricity. This results in 14.1 GW of the electrical energy used by industry and services, this is approximately half of our electrical energy usage. Now I am sure that you are asking the question, what about on weekends? Do we use significantly less energy on the weekend as industry is reduced? Well the answer to that is that domestic and services increase and the difference is only a reduction of about 5 GW. This is well reflected in the statistics from Sunday 22nd to Monday 23rd when we have been asked to shut down non critical business. In this case the electrical demand is a difference of 1.06 GW.
The problem therefore comes if office based individuals were to remain working at home but industry and services were to re-open as this isn’t a typical scenario. In this case approximately 10 GW would be added to our electrical load demand, this would push the demand above last year’s peak.
When we consider electric vehicles, a similar trend can be observed. By the year 2030 all new vehicles will need to have an electrical component to them, be that hybridisation or fully electric. Malcolm McCulloch, head of Oxford University’s Energy and Power group, states that the capacity of the National Grid would need another 20 gigawatts to support this (Priday, 2018). This is just to support electric vehicles. We also need to add in that electricity demand has fallen by 1.1% each year, which over 10 years would equate to a decline of 4.66 GW.
In total our peak energy demand would therefore grow from 48.8 GW to 64.1 GW which is an increase of 31.3%. This raises the question of how to generate this much more electrical energy in the next 10 years.
Nuclear Power to the Rescue
Nuclear power has a bad reputation among the general public and there have been some horrendous accidents in the past but in each case we have learnt. The biggest difference between older reactors and the next generation research is that they are unable to melt down due to using completely different radioactive materials and passive safety measures.
Even if we don’t look to nuclear power in the future we need to do something to address this demand. If we consider our total offshore wind installation we have an overall capacity of 12 GW. We would need to double this and then some to keep up with the 15.3 GW demand increase.
If we consider the expected performance of large scale next generation Molten Salt Reactors (MSR’s) they can generate in the order of 500MW meaning that we would need 30 reactors to keep up with the demand. This might seem like a lot but France currently has 58 nuclear reactors in operation (conventional designs).
If we perform the same analysis on wind turbines they produce an average of 3.6 MW meaning we would need to install 4260 new off shore wind turbines to keep up. Now ignoring the running costs, installation, maintenance and other factors the first hurdle that needs to be faced is that the UK has more than enough land for 30 next generation MSR’s but we have already used the best locations for wind turbines and we now need to go further from shore to find viable sites that increase all factors of running wind farms. The other major component is that wind isn’t reliable. Across 2019 the lowest wind generation was only 0.69 GW and the maximum was 10.67 GW. That’s not to say that wind and solar aren’t useful as they currently supply a significant portion of our energy mix. The important take away from this is that a reliable constant base load needs to be installed to help manage with these dips. Therefore we need something to support this future and to achieve this we need to look to alternate sources of energy, this is where the next generation of safe nuclear reactors comes in.
What are they and how do they work?
A MSR is a type of nuclear reactor that uses a liquid fuel mixture instead of fuel rods that are used in conventional nuclear reactors as the primary control system. This results in an important differentiation between existing technologies and thorium based MSR’s in that they are completely safe and cannot melt down.
In the left of the picture above the reactor is shown, this consists of a fluid loop that contains the fuel salt. This is the fuel which can be a number of different elements (Uranium-235 or Thorium) which is dissolved in a mixture of fluoride salts. To start the reactor a fission chain reaction is started inside the reactor core. Once this has been set off the system stabilizes at around 700 – 1000 °C depending on the fluid composition. It is at this point where the first safety system resides, if the reactor gets hotter than its design point the fluid expands. This results in the fuel salt being pushed into the recirculation loop, in doing so this decreases the fission rate as fission cannot be maintained inside the recirculation loop. This causes the fuel to cool as a result.
If this isn’t enough and the temperature continues to rise for whatever reason then the freeze plug plays its part. This is positioned directly below the reactor, the plug is made of the same salts used in the system but is held in a solid state by a fan. If the temperature gets too great in the reactor loop it melts and the fissionable liquid flows down under gravity into the emergency dump tanks. By using multiple small tanks, fission cannot sustain itself and the system cools and stops safely.
The next safety system is the traditional control rods, while the system is extremely stable by design these offer additional control of the reaction and a way to control the power generation. They work by absorbing neutrons that would otherwise support the fission reaction.
The molten salt is pumped around the system, after passing through the reactor core it is circulated through a heat exchanger where it interfaces with a second molten salt loop. The difference here is that it is not doped with fissionable material. The heat from this loop is then available for a number of applications, we could generate power using either a steam or supercritical CO2 system, this is the application that we are interested in here. The other option is to use this heat for a process. This is particularly the case in small scale reactors that are currently being investigated for industrial processes.
The other thing to note is that the fuel salt is bled off into a chemical processing plant. This is used to “clean” the salt of spent material and to add more fuel to the reactor.
System Performance
SimcenterTM FlomasterTM has the capability’s to model these systems under a range of operating conditions. Out of the box all of the components are available to create a molten salt reactor quickly and easily and we have done just that to demonstrate some of the concepts to you.
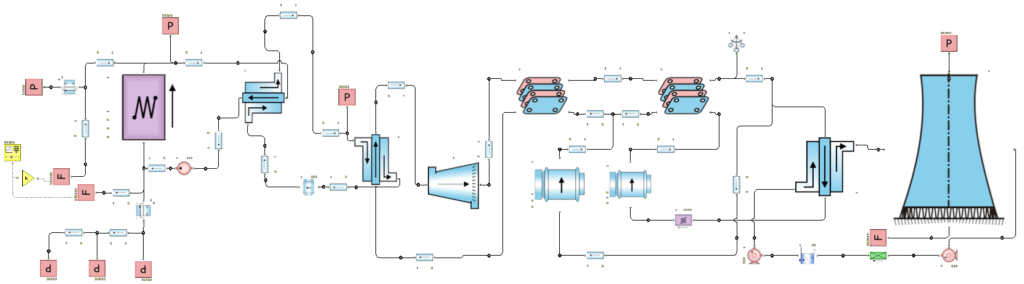
This system represents the reactor which is shown in purple, it then has the primary and secondary loops and a power generation system. In this case thorium is used in the fuel solution and should ideally be operation at about 900 °C. We can look at the results in greater detail here:
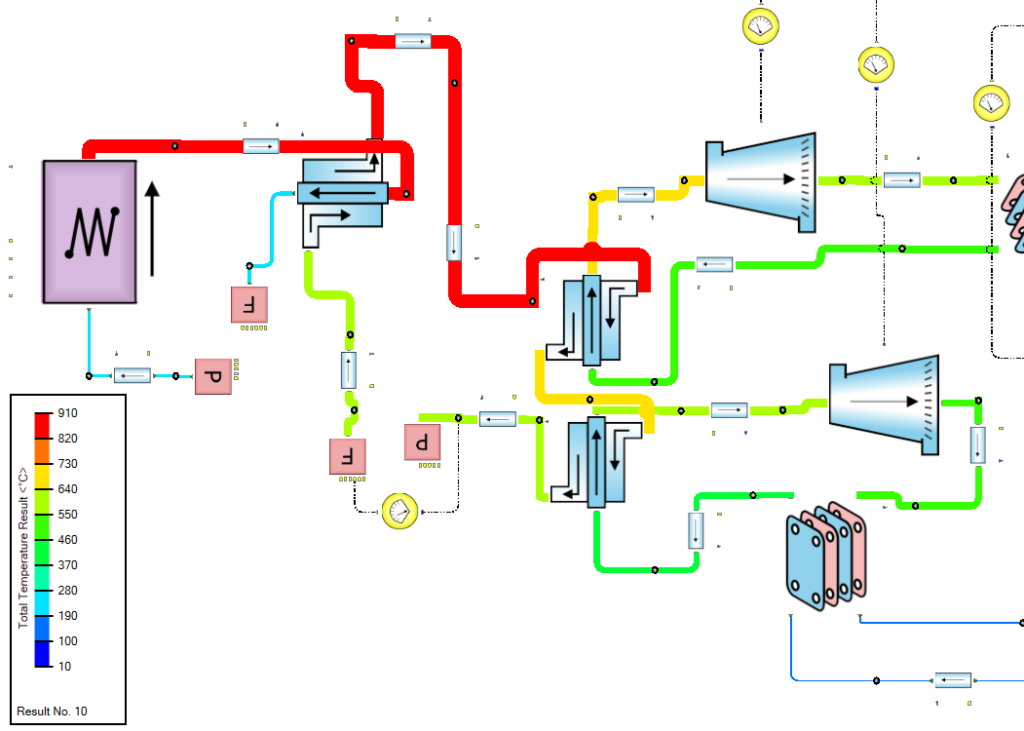
We can see that the system is operating at 910 °C and is able to pass that onto the two power generation loops so that we can generate electrical power. Another important aspect of the system is the flow rates:
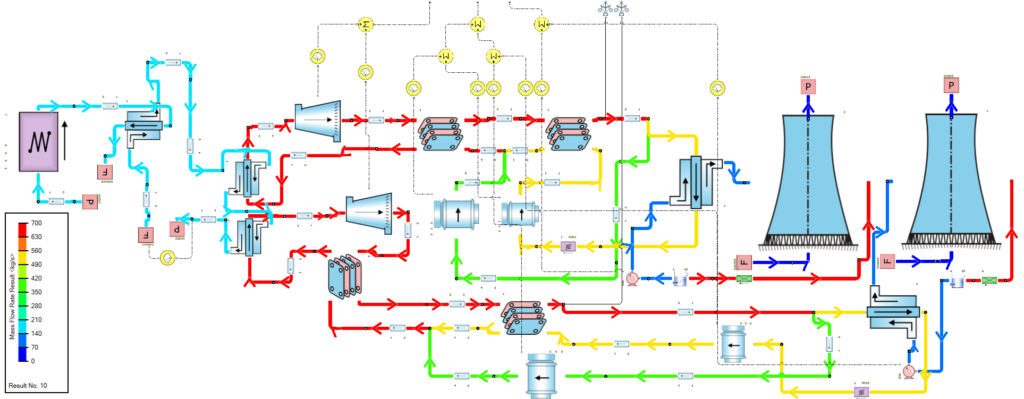
Now that we have visually inspected the system to determine the operating point and determined that it is working as expected we can look at the questions we posed earlier. That is, how much power this system generates. At the turbines we are generating a total of 460 MW which is in line with systems that we reviewed earlier. However we must also consider the pumping losses around the system. By combining the compressors and pumps the electrical draw is 50 MW so we are actually generating 410 MW that is usable. When compared with the wind turbines the power is over 100 times greater. This is also a stable base load that could always be available, it isn’t dependent on any other factors. We have demonstrated that is it extremely safe when compared with traditional nuclear systems too and one final point of note is that the byproducts cannot be weaponized as in traditional systems, in fact the waste from traditional reactors can be used in MSR reactors as new fuel.
So there is a good chance that our power from the plug that will be used to run our homes, offices, industry and electric vehicles could be coming from not just wind turbines and solar plants but also nuclear reactors in the future as we start to understand these next generation reactors more.
Hopefully this has peaked your interest in Generation IV molten salt reactors and also helped to answer a question perhaps a little better that a famous politician once so eloquently answered:
Where does electricity come from to power your electric cars?
The plug.
References
Nasa Earth Observatory, 2020. Airborne Nitrogen Dioxide Plummets Over China. [Online]
Available at: https://earthobservatory.nasa.gov/images/146362/airborne-nitrogen-dioxide-plummets-over-china
[Accessed 2 March 2020].
Neil M Ferguson, D. L. G. N.-G. N. I. K. A. e. a., 2020. Impact of non-pharmaceutical interventions (NPIs) to reduce COVID19 mortality and healthcare demand, London, UK: Imperial College COVID-19 Response Team. Link