SimRod experience: From Belgian blocks to vehicle durability testing (part 3)

I ended my last blog post by explaining why it is so important to validate the data that was measured on the different tracks of the proving ground. We namely need to ensure that this data can be used to calculate our vehicle’s durability performance. And for this, we do not only need to check the data quality but also the test procedure quality.
In this blog post, I would like to go a little deeper on ‘how to check if the pre-defined test procedures were followed correctly during the actual measurements’.
During our test campaign on the Aldenhoven proving ground, we drove at two different speeds over the Belgian block and sawtooth profiles, namely at 30 km/h and 50 km/h. I want to check if we drove indeed at these speeds over the different tracks.
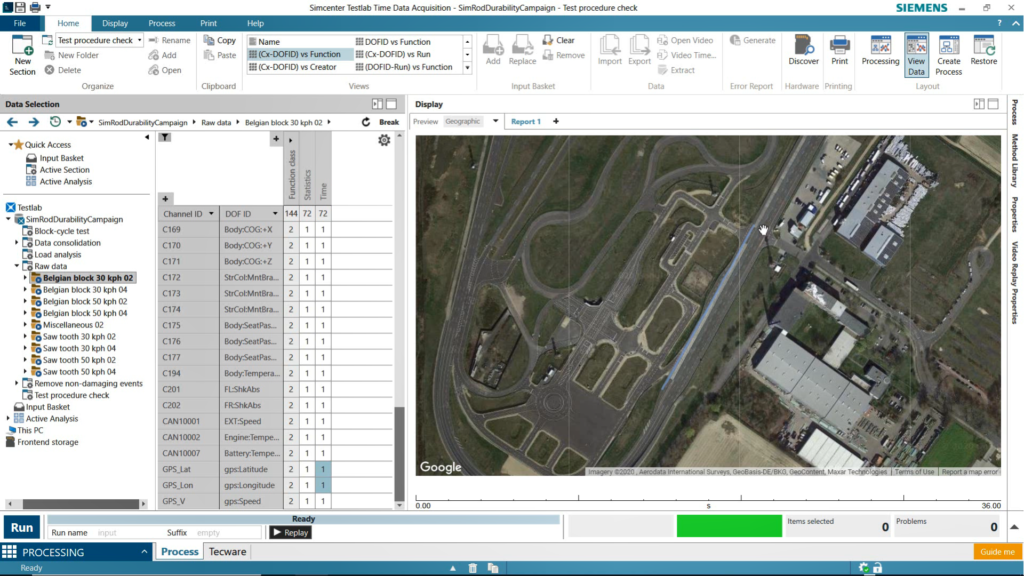
As explained previously, with the so-called ‘Pivot table‘ and ‘Preview‘ display features in Simcenter Testlab Neo, you can quickly and quickly create a compact overview of all the desired measured channels and runs during or right after the measurement. But despite the fact this the test engineer can save much time in visualizing a large set of data, he still needs to check manually if the speed was OK or not. This is time-consuming and also sensitive to interpretation.
Embedded durability testing methods
That is where the processing capabilities of Simcenter Testlab Neo come in very handy!
Simcenter Testlab Neo is not only software with which you can define your channel setup, do the actual measurement and visualize the acquired data. No, it also offers a complete toolbox with embedded durability testing methods to perform a detailed validation, cleanup, and durability analysis of the measured data, all in one single software platform!
Whereas with other processing software available on the market, you need to know how to program and maybe learn some programming language. In Simcenter Testlab Neo, processing data is a very visual operation. To create a full process, you simply drag & drop so-called ‘method blocks’ from an extensive library & connect them.
Test procedure check
To check if we drove at the pre-defined speed over the two durability tracks, I created the following process in Simcenter Testlab Neo:

There are two main parts in this process:
- there is a part where I will cut the measured data to the desired length (grey box)
- and there is a part where I did the actual speed checking (light blue box).
GPS-based data cutting
One of the durability testing methods in Simcenter Testlab Neo is the ‘GPS split‘ method. With this method, I can cut the data to the test track’s exact length. Since I started to measure a couple of meters before the start of the durability track and stopped the measurement a couple of meters after the end of the track, I want to remove these parts from the actual speed calculation since they would affect my mean speed.
The only input the ‘GPS split’ method needs is a so-called track definition that defines the test track’s start and end. You can create such a track definition in, for example, Google Earth by marking the start and end with a simple (yellow) line :
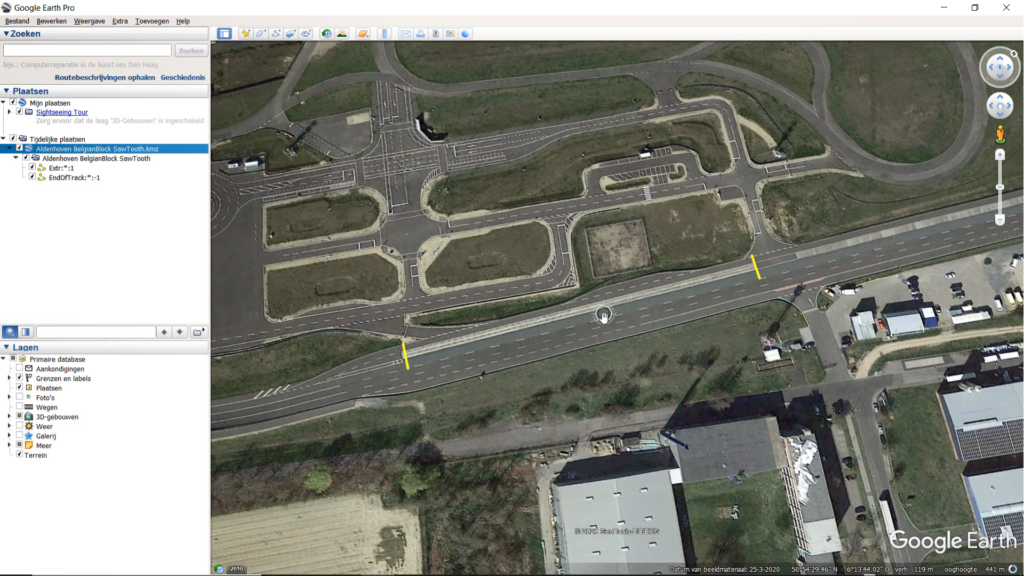
Using this track definition, the Simcenter Testlab Neo software will cut everything from my signal before the first yellow line and everything after the second yellow line.
Mean speed check
In the second part of the process, I will do the actual checking.
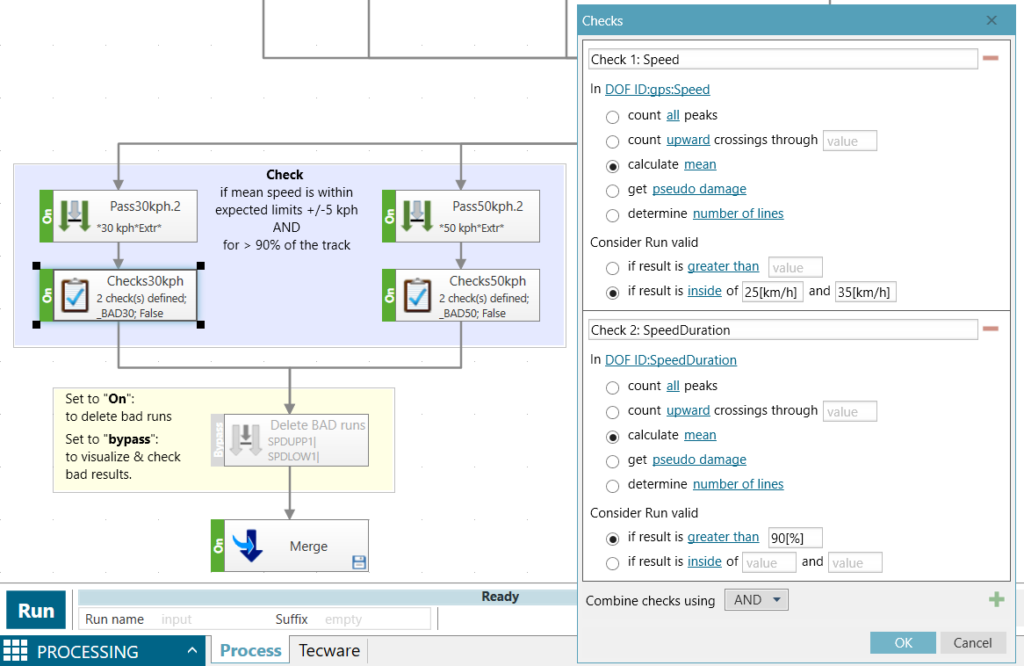
For this, I am using one of the other useful durability testing methods in Simcenter Testlab Neo, the ‘Checks‘ method. As you can see in the properties of this method, I check if the mean speed is between the pre-defined speed limits (f.e. 25 and 35 km/h) but also if the speed stays within those limits for at least a certain amount of time (90% in this case):
When I run my process, the ‘Checks’ method will add a “_BAD30” or “_BAD50” suffix to the names of those runs which not comply with one of those conditions.
Visual confirmation of the rejected data
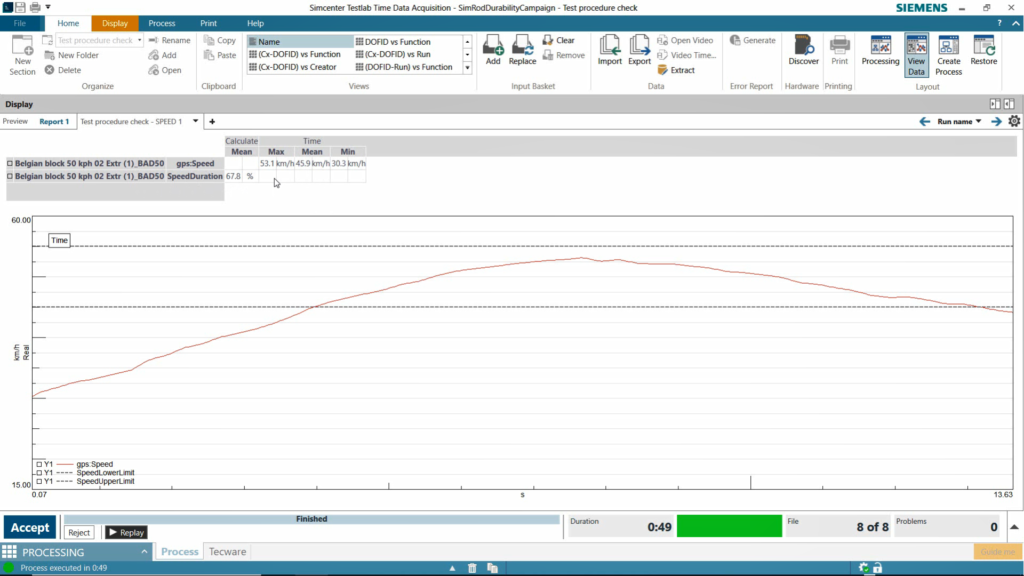
Like this, it becomes easy for me to select only the bad runs and do a final visual check to see why the software marks it as bad. In the screenshot below, this specific run was marked as bad because the mean speed was only for 68% of the time within the defined 45-55 km/h speed range:
As you can see, by using the track-side validation methods in Simcenter Testlab Neo, like the ‘GPS split’ and ‘Checks’ methods, you can validate immediately after the measurement in a fast but objective way if your runs complied with the pre-defined test conditions.
Would like to get another example of the test procedure validation capabilities of Simcenter Testlab Neo? Please refer to my latest blog on automated data validation with Testlab Workflow Automation!
In-depth durability analysis
Once the data is validated and approved, we can use this data for further analysis.
Data analysis does not only mean cleaning up the data, like detecting and correcting possible signal anomalies (spikes, drifts, offset, …). It also means conducting some more in-depth load data analysis to get an idea of my vehicle’s durability behavior.
Besides several methods to clean up the measured data, Simcenter Testlab Neo also provides a complete toolset of other durability testing methods to qualify and quantify the damage potential of the applied loads on my vehicle. And all this in the same software, no need to transfer or convert the data to another software tool!
Damage insights from measured loads
Here below a screenshot of the process, I created to analyze the data I had measured on the durability test tracks of the proving ground:
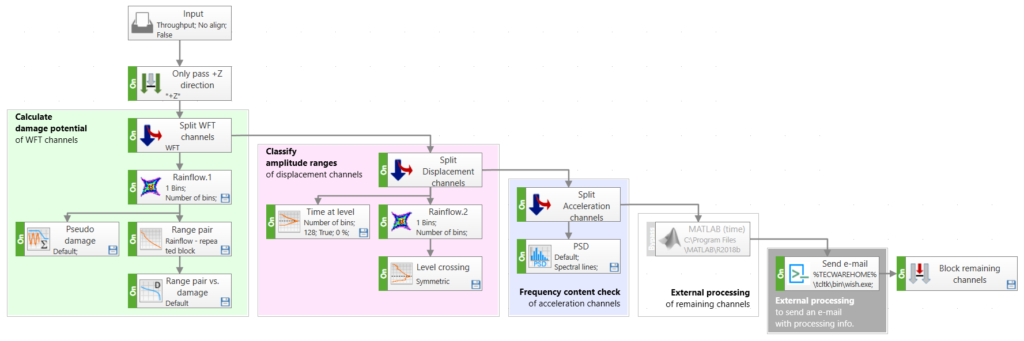
As you can see, depending on the channel type, I apply different durability testing methods.
- I calculate the damage potential of the wheel force transducer channels (green box) using the ‘Rainflow counting,’ ‘Range pair,’ and ‘Pseudo-damage’ methods.
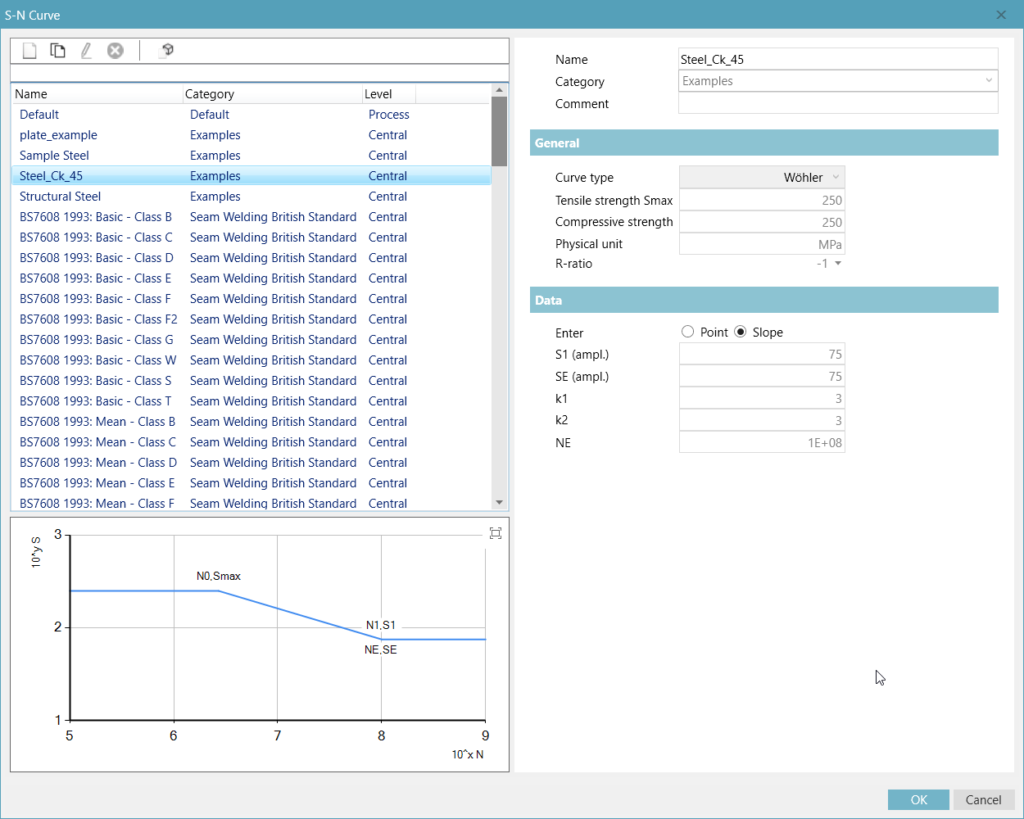
To calculate damage, you need an S-N curve. The Simcenter Testlab Neo software comes with an extensive database of S-N curves for different materials, which you can choose from:
- I classify the displacement channels according to the amplitude ranges by calculating level crossing and time at level.
- And then finally, I do a frequency content check of the acceleration channels by calculating the PSD.
- Simcenter Testlab Neo also offers methods allowing you to execute code or algorithms you have created with other processing tools, like Matlab or Python. This is especially very handy when you already have developed and validated some specific data processing in the past and do not want to recreate this. Just copy the code into the method and run it from within Simcenter Testlab Neo.
Scrolling through the results
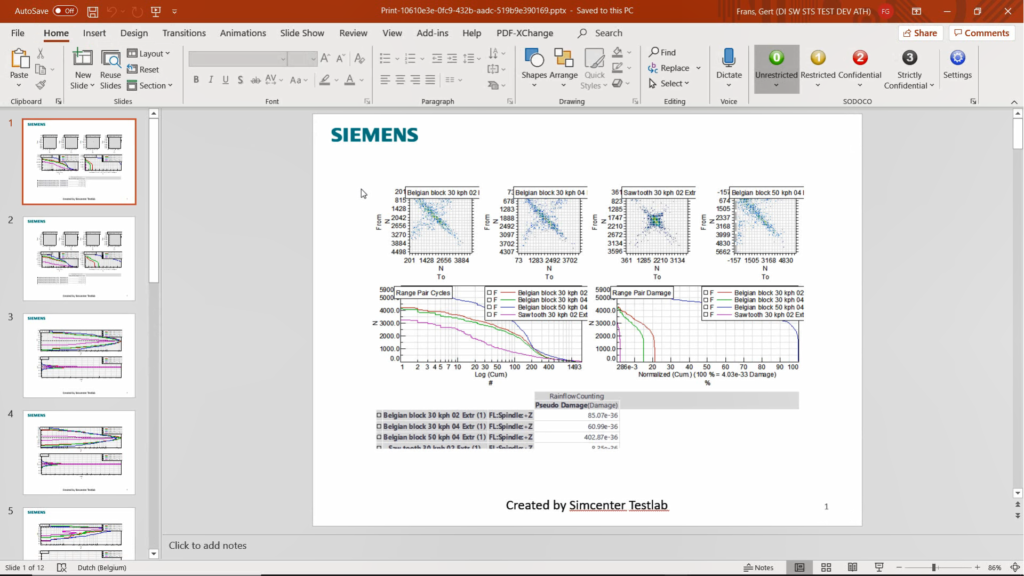
To check the final processing results, you will again experience the power of the ‘Pivot table’ and ‘Preview’ picture! With one click in the ‘Pivot table’, you automatically display all calculated results onto one single window:
Beneath the rainflow matrices at the top of the window, you see the range pairs of the four runs expressed in cycles and in damage. You immediately see that the blue curve is causing the most damage. This blue curve corresponds with the run on the Belgian block track at 50 km/h. This high damage you can also read from the ‘Pseudo Damage‘ table below.
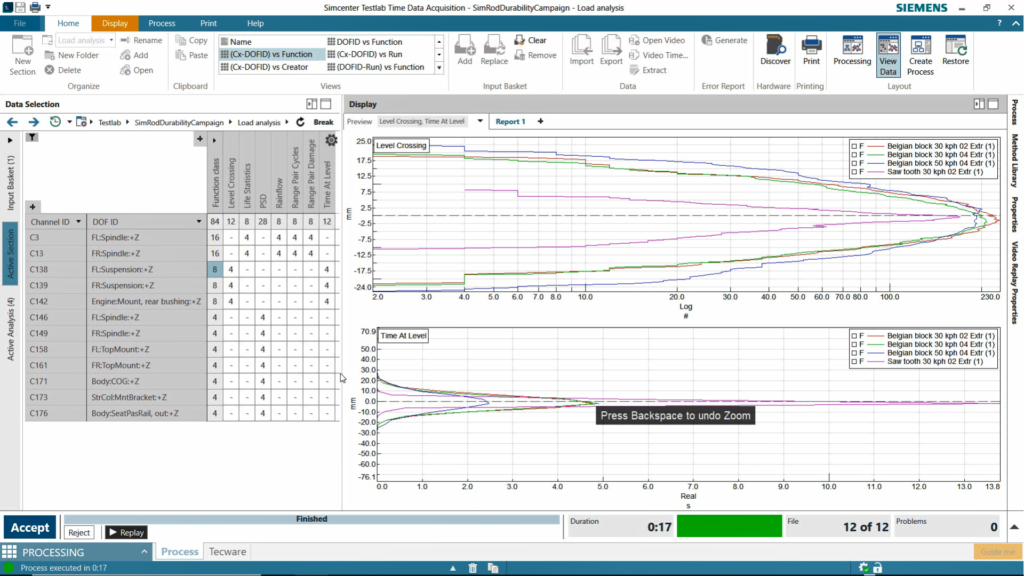
When scrolling down in the ‘Pivot table’ to the displacement sensors, you see the calculated level crossing and time at level …
… and for the acceleration channels, you see an exact comparison of the PSDs of the four remaining runs:
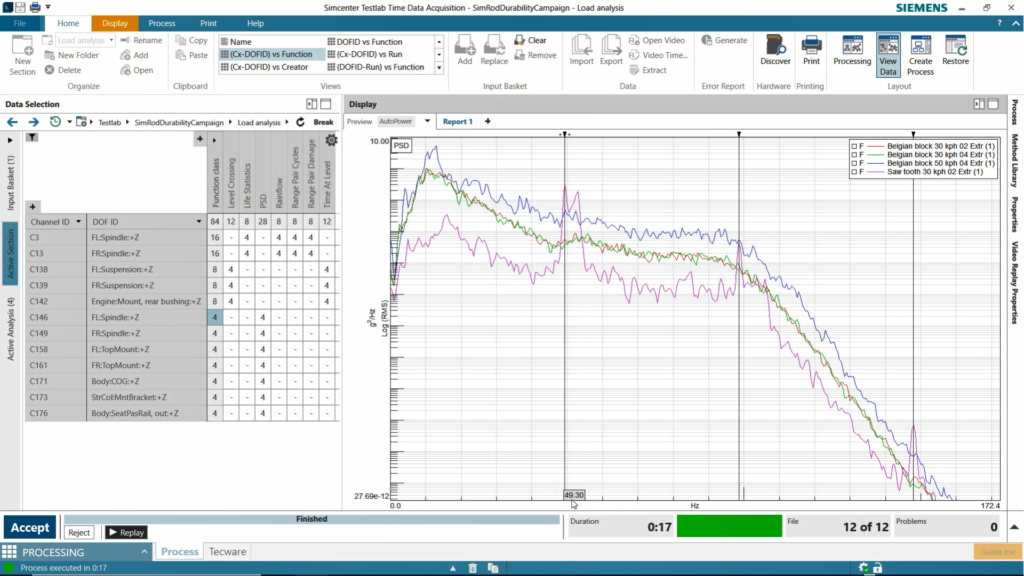
In this last graph, you also see that the blue curve has the highest PSD value.
Easily share campaign results with active reports
When all data is consolidated and analyzed, of course, you want to share it with other teams from the simulation or test bench department.
Now, this is a job which takes more time than you think! And unfortunately, each hour the test engineer spends on making reports with nice, fancy screenshots is an hour he cannot spend on doing measurements.
On top of that, in many cases, the job is not done after this! We typically see reports from competitive software containing screenshots, static bitmaps. So the information you get is limited to what you see in the screenshot. So whenever the person who receives the report raises some questions and wants to see more than a static screenshot, the test engineer needs to go back to his acquisition or processing software, make new screenshots and add them to the report.
Luckily with Simcenter Testlab Neo this is a thing of the past! With one button-click, you can generate an insightful visual report in Microsoft Word or Powerpoint with so-called ‘Active ‘pictures‘ for multiple channels and runs.
Create an ‘Active report’
To create such a report, you select the first channel in the ‘Pivot table’ and click the [Report] button in the Simcenter Testlab Neo software’s title bar.
The result is a Microsoft Word or PowerPoint report containing all the graphs from the ‘Pivot table’ for all channels and runs:
… and customize it!
But these graphs are also just screenshots, you say? Wrong! When you double click on such a screenshot, you can edit these graphs as if you are still working in the Simcenter Testlab Neo software:
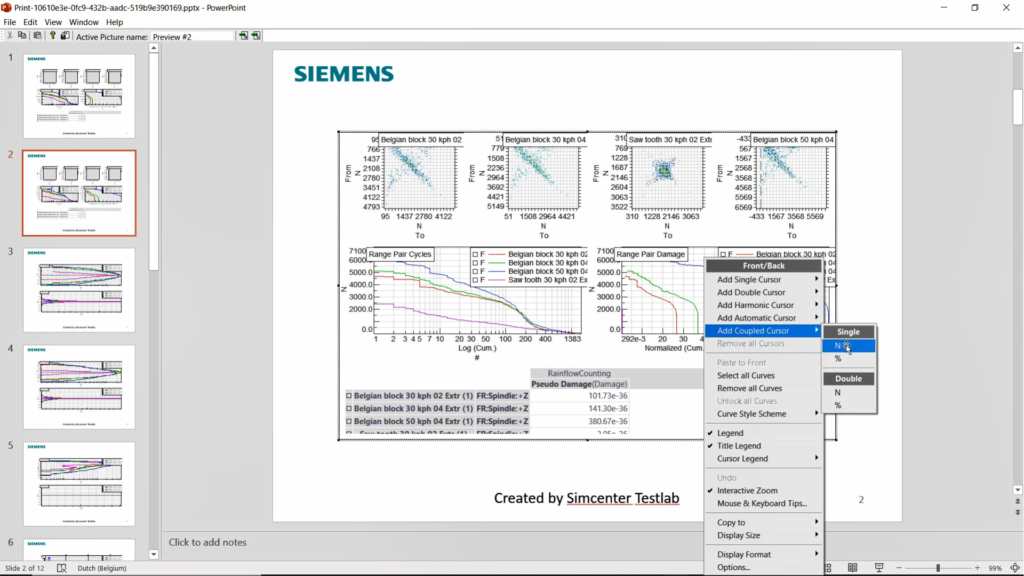
You can add cursors, extra information in the legend, zoom in on a specific part of the graph, change line color, …. All this without the test engineer’s help or even without having Simcenter Testlab Neo installed on your PC! By the time a colleague edited the report, the test engineer already had done a couple of new laps on the test track!
Although many our customers already confirmed this, I was happy to experience myself the Simcenter solution for durability testing is all about maximizing the productivity of the test engineer.
Thanks to the universal signal conditioning of the Simcenter SCADAS data acquisition system and track-side validation with the Simcenter Testlab Control app, but also thanks to the instant data visualization, automated data validation, and embedded durability testing methods of the Simcenter Testlab Neo software, I could deliver high-quality data within the foreseen time.
Those of you interested in compressing your long-duration durability measurements into shortened or how to calculate fatigue life out of strain measurements: stay tuned for my next blog post!
And in the meanwhile, check out our website for more information.